
Learn 9 essential AI observability components that catch model failures, reduce costs, and maintain reliability in production.
Additional resources


You probably won't spot an AI failure until it hurts. Hallucinated answers, runaway token bills, and black-box decision paths make it nearly impossible to explain why a chatbot overcharges a customer or an AI recommendation engine drifts into bias.
Traditional monitoring stops at CPU spikes and 500 errors, signals that mean little when a large language model confidently produces the wrong answer. Your AI systems require visibility into every layer, including prompts, embeddings, agent workflows, infrastructure, and user context.
AI observability provides a comprehensive view, with nine essential components that work together to expose hidden failure modes, reduce costs, and ensure your models are reliable, auditable, and safe in production.

What is AI observability?
AI observability is a practice that provides deep insight into how AI models and systems function by monitoring, analyzing, and visualizing their internal states, inputs, outputs, and performance over time.
From raw data and prompts to GPU temperature and model outputs, AI observability provides real-time visibility into every layer of your system.
Unlike traditional observability, which tracks deterministic code paths, AI observability watches probabilistic behavior, surfacing how a model reasons, drifts, or hallucinates while the infrastructure appears to be perfectly healthy.
Benefits of comprehensive AI observability
Comprehensive AI observability delivers tangible advantages that impact both technical performance and business outcomes:
Cost management: Fine-grained telemetry tracks token spend, GPU cycles, and idle models, converting reactive cost audits into proactive optimization
Accelerated debugging: Unified traces connect UI clicks, orchestration chains, and model calls, allowing you to follow requests across tool boundaries without manual log stitching. Pattern clustering identifies when agents go off-script, reducing root-cause analysis from hours to minutes
Regulatory compliance: Immutable traces and versioned prompts satisfy emerging mandates, such as the EU AI Act, while providing auditors with clear, breadcrumb-like trails.
Quality assurance: Drift, bias, and hallucination metrics stream through live dashboards, catching silent degradations before users notice.
Innovation velocity: Engineering teams escape the manual monitoring treadmill, redirecting their time from firefighting to feature development.
Stakeholder confidence: Executive dashboards translate technical metrics into business impact, showing exactly how AI investments deliver ROI.
Cross-team alignment: Unified observability creates a shared ground truth across engineering, product, and compliance teams. When everyone views the same traces, metrics, and failure patterns, political debates about "whose fault it is" transform into collaborative problem-solving
To get these benefits, comprehensive AI observability demands an end-to-end framework where nine essential components work together like interlocking gears. Remove one, and the entire reliability engine stalls.
These components span from data capture to large-scale infrastructure, each solving specific pain points while contributing to a seamless monitoring workflow.
AI observability component #1: Data and telemetry collection
You probably discover gaps the first time an LLM fails: model logs live in one bucket, vector-DB stats in another, and orchestrator events nowhere at all. Traditional application logging can't capture token counts, tool calls, or retrieval hits, so you end up piecing incidents together by hand.
A unified, schema-rich event format, think OpenTelemetry plus the emerging GenAI semantic conventions, eliminates those blind spots.
Stream every prompt, response, embedding lookup, and latency metric into a single pipeline for trivial cross-layer correlation. Capture at minimum:
User prompt
System prompt
Token usage
Model name/version
Embedding query ID
Tool function call
Cost metadata
With standardized telemetry across every component, you gain the ability to correlate prompts with outputs, track token usage against billing, and audit specific model behaviors across thousands of interactions.
This unified view becomes especially critical when debugging multi-modal AI systems where failures might originate from image processing but manifest in text outputs, or when tracing complex RAG flows that span document retrieval, embedding generation, and final synthesis.
AI observability component #2: Comprehensive metrics suite
Effective AI observability depends on measuring the right signals across your entire system stack. Galileo's metrics framework provides specialized metrics beyond traditional accuracy measures, targeting the unique challenges of modern AI systems:
Expression and readability: Metrics that evaluate the style, tone, clarity, and overall presentation of AI-generated content. When the format, tone, and presentation of AI outputs are important for user experience or brand consistency.
Model confidence: Metrics that measure how certain or uncertain your AI model is about its responses. When you want to flag low-confidence responses for review, improve system reliability, or better understand model uncertainty.
Response quality: Metrics that assess the accuracy, completeness, relevance, and overall quality of AI-generated responses. When evaluating how well AI systems answer questions, follow instructions, or provide information based on context.
Safety and compliance: Metrics that identify potential risks, harmful content, bias, or privacy concerns in AI interactions. When ensuring AI systems meet regulatory requirements, protect user privacy, and avoid generating harmful or biased content.
For agent workflows, you need metrics like tool selection quality and action completion to verify proper reasoning steps and effective task completion.
The most effective metrics frameworks combine real-time signals (detecting immediate issues like hallucinations) with longitudinal tracking (identifying subtle degradations in performance over time).
AI observability component #3: Application and agent tracing
How can you follow a decision that jumps from a React front end to LangChain, then through four tools, and back? Multi-step agents split traces across frameworks, leaving you guessing where the plan went off track.
Session-level tracing solves this puzzle by preserving a single correlation ID from user click to final answer. Span relationships reveal forks, retries, and external API calls, even when the workflow spans multiple clouds.
Graph visualization layers on top of those traces to shrink "hours of spelunking" to "minutes of inspection," letting you pinpoint the exact tool invocation that returned malformed JSON without wading through megabytes of raw logs.
When autonomous agents make decisions in production, their execution paths create exponential complexity that traditional tracing can't handle. Hierarchical spans solve this by mapping the logical flow of an agent's reasoning process, from planning and tool selection to parameter formatting and error recovery.
This structural view reveals subtle coordination failures, like when an agent repeatedly tries the same failing approach or selects tools in the wrong sequence. With this clarity, you can implement targeted fixes at the exact step where decision quality degrades rather than rewriting entire agent workflows.
AI observability component #4: Real-time evaluation engine
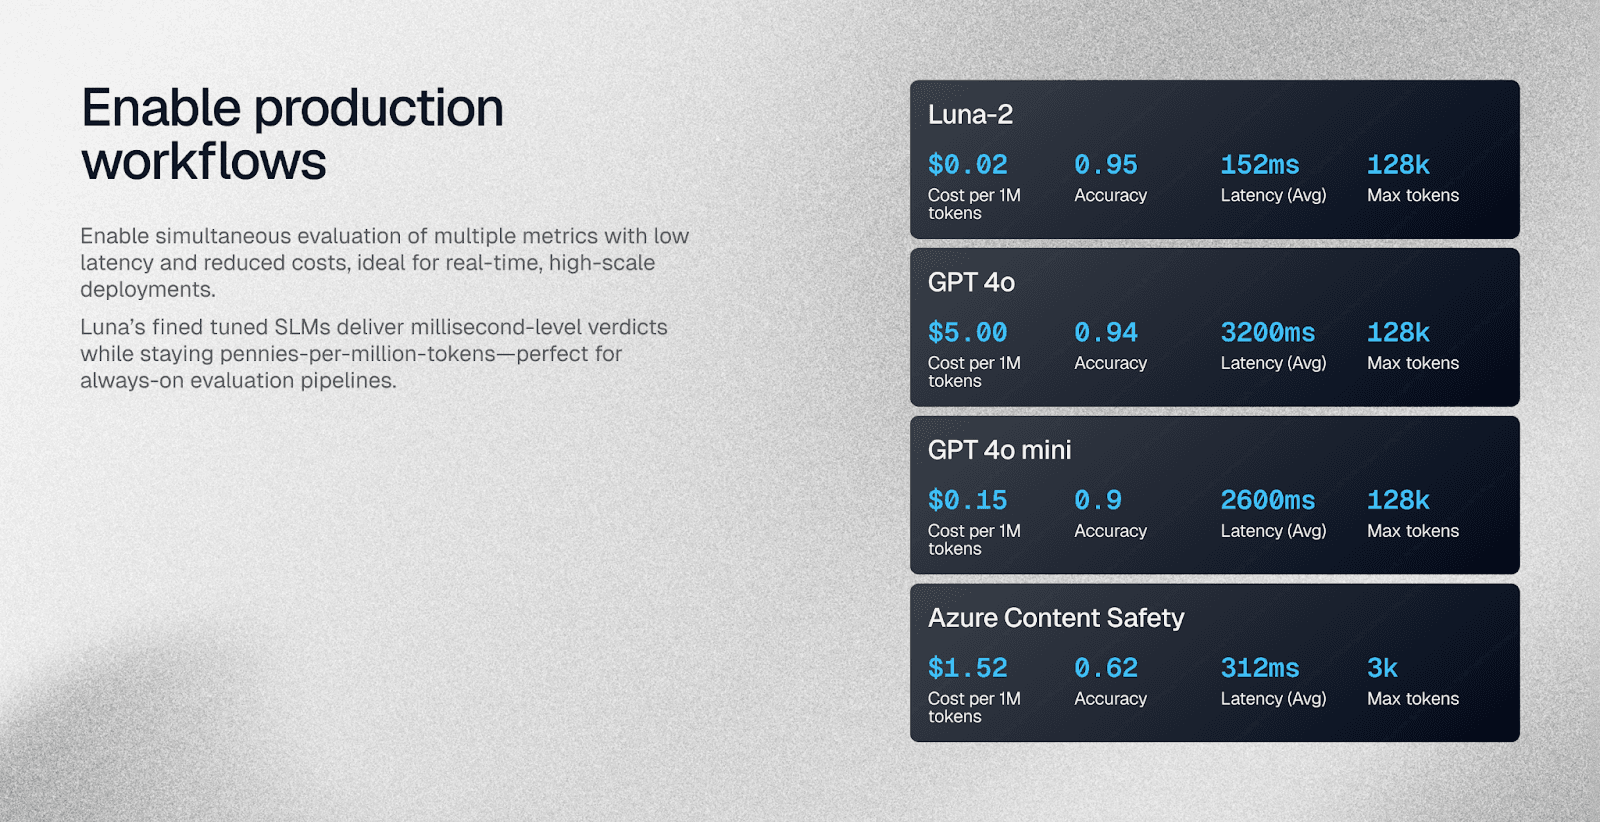
Manual QA can't keep pace when your agent delivers thousands of answers per minute, and GPT-based evals rack up eye-watering bills. You need automated, low-latency metrics that score every response for quality, drift, and hallucination—without blocking the release train.
Lightweight evaluators that run continuously provide the solution. Galileo's Luna-2 small language models take this approach further, delivering sub-200 ms evaluations at 97% lower cost than full-size LLM checks.
These modern evaluation engines use complementary approaches to balance rigor with resource constraints. Statistical evaluations catch distribution shifts in model outputs, semantic evaluations assess meaning preservation regardless of phrasing differences, and reference-based metrics validate content against source material.
Track core signals such as answer correctness, grounding to retrieved documents, bias, toxicity, and token efficiency. Balance depth against compute: run shallow relevance checks on every call, deeper factuality sampling on a rolling subset.
This multi-layered approach creates a safety net that catches different failure types: hallucinations that sound plausible but contradict facts, on-topic responses that miss critical nuance, and technically correct answers that fail to meet user needs or business requirements.
AI observability component #5: Automated failure detection and root-cause analysis
Scrolling through logs at 3 a.m. is nobody's idea of reliability. Worse, AI failures rarely throw stack traces—they manifest as subtle behavior shifts that can cost companies millions annually in silent anomalies.
ML-powered clustering flips the script: instead of hunting for issues, you let algorithms surface recurring failure modes such as planning loops, tool-usage errors, or sudden cost spikes.
Advanced engines like Galileo's Insights Engine group similar error traces and explain the underlying pattern, so you know not just that hallucinations spiked, but that they correlate with a new knowledge-base index.

Tune alert sensitivity to avoid noise while watching the mean-time-to-resolution plummet.
However, a single retrieval error might trigger multiple agent planning attempts, followed by inappropriate tool invocations, and finally a hallucinated response masking the original issue.
Pattern recognition across millions of traces becomes essential for identifying these causal chains and pinpointing the actual root causes.
When implemented effectively, these systems transform from reactive debugging aids into proactive alert systems that warn about emerging issues before they reach critical thresholds or impact user-facing applications.
AI observability component #6: Runtime protection and guardrailing
Rather than finding bad outputs after they reach users, intercept them in line. Black-box models can appear operationally healthy while producing harmful responses. Inline guardrails apply deterministic actions, block, rewrite, or pass through, without adding perceptible latency.
Critical protections include PII redaction, bias checks, policy compliance, and hallucination suppression. Galileo's Protect API can help you run Luna-2 evaluations on each candidate response, rejecting content that violates safety or regulatory rules before the HTTP 200 ever leaves your gateway.

Runtime protection requires sophisticated policy management to balance safety with user experience. Rather than one-size-fits-all filters that frequently produce false positives, effective guardrails combine domain-specific heuristics with real-time statistical confidence scoring.
This approach makes contextual decisions: detecting when a medical system appropriately discusses sensitive topics versus when a customer service bot inappropriately requests personal information.
You get to maintain utility while eliminating late-night hotfixes for embarrassing outputs.
AI observability component #7: Continuous learning and metric tuning
Static evaluators get stale as soon as your domain shifts. Continuous feedback loops keep metrics aligned with real-world data by collecting frontline feedback, thumbs-down clicks, support tickets, SME reviews, and feeding them back into your evaluators.
Leverage proven CLHF flow to re-tune metrics with as few as two to five curated examples, letting you adapt to new jargon or emerging user intents in minutes.
For example, when a healthcare chatbot starts misclassifying rare symptoms, a quick retrain tightens the detector before misdiagnoses pile up. Continuous tuning transforms your metrics from static gatekeepers into living quality guardians.
However, the efficiency of feedback integration determines how quickly your systems adapt to changing conditions. Traditional approaches required weeks of data collection and full retraining cycles, creating a dangerous lag between problem identification and resolution.
Modern continuous learning pipelines shrink this window by implementing efficient fine-tuning mechanisms that can update evaluation models without disrupting production services.
AI observability component #8: Compliance and audit trails
Regulators now require you to demonstrate not only that your model works, but also why it made each decision. The EU AI Act and sector-specific rules demand immutable logs, data lineage, and policy enforcement.
Capture every prompt, dataset version, model hash, and policy file in an append-only store. Balance retention with cost by tiering hot and cold storage.
Effective compliance systems go beyond passive logging to enable active governance. They create structured records that map directly to regulatory requirements, maintaining documentation of risk assessments, model validation procedures, and intervention policies.
These systems also track the provenance of data and models throughout their lifecycle, ensuring you can answer critical questions like:
Which version of which model processed this specific transaction?
What dataset was used to train that model component?
This level of traceability becomes essential when responding to regulatory inquiries or conducting internal audits across large-scale AI deployments with frequent updates.
AI observability component #9: Scalable infrastructure and integration layer
Proof-of-concept scripts buckle under production loads. Containerized microservices, autoscaling GPU pools, and queue-based back-pressure keep latency stable as usage surges.
Infrastructure decisions have a direct impact on observability capabilities at scale. Traditional database designs often collapse under the high-cardinality data patterns common in AI systems—where every prompt, embedding hash, and model call represents a unique dimension.
Purpose-built time series stores with efficient compression and columnar layouts allow for sub-second query performance even across billions of events.
Similarly, thoughtful data retention policies preserve critical information while managing storage costs through intelligent downsampling of historical data and preservation of only the most significant anomalies and incidents after aging thresholds.
Finally, your observability layer must scale alongside: framework-agnostic APIs, cloud or on-prem deployment, and distributed storage that can retain months of high-cardinality metrics.
Galileo processes 50,000+ live agents across AWS, Azure, and GCP, proving the design can grow well past initial pilot stages. Size your clusters for peak concurrency, add headroom for sudden traffic spikes, and integrate observability hooks into every new service by default.
That way, reliability scales, instead of technical debt.
Elevate your AI reliability with Galileo
Moving AI systems and autonomous agents from demo to production requires more than occasional spot checks; you need round-the-clock, multi-layered visibility.
Galileo’s Agent Reliability Platform wraps evaluation, tracing, and guardrailing into a single workflow:
Automated quality guardrails in CI/CD: Galileo integrates directly into your development workflow, running comprehensive evaluations on every code change and blocking releases that fail quality thresholds
Multi-dimensional response evaluation: With Galileo's Luna-2 small language models, you can assess every output across dozens of quality dimensions, correctness, toxicity, bias, adherence at 97% lower cost than traditional LLM-based evaluation approaches
Real-time runtime protection: Galileo's Agent Protect scans every prompt and response in production, blocking harmful outputs before they reach users while maintaining detailed compliance logs for audit requirements
Intelligent failure detection: Galileo’s Insights Engine automatically clusters similar failures, surfaces root-cause patterns, and recommends fixes, reducing debugging time while building institutional knowledge
Human-in-the-loop optimization: Galileo's Continuous Learning via Human Feedback (CLHF) transforms expert reviews into reusable evaluators, accelerating iteration while maintaining quality standards
Get started with Galileo today and discover how comprehensive observability can elevate your AI development and achieve reliable AI systems that users trust.