
Real-time AI evaluations demand millisecond latency because any slowdown directly impacts user-facing response time. We built our Luna-2 small language models to enable exactly that: guardrails that evaluate safety without slowing down your application.
However, getting these models to perform in production required us to rethink standard load balancing. By building a load-aware client-side balancer backed by Redis, we achieved a ~40% increase in average GPU utilization and reduced tail latency by 70%. Here is how we did it.
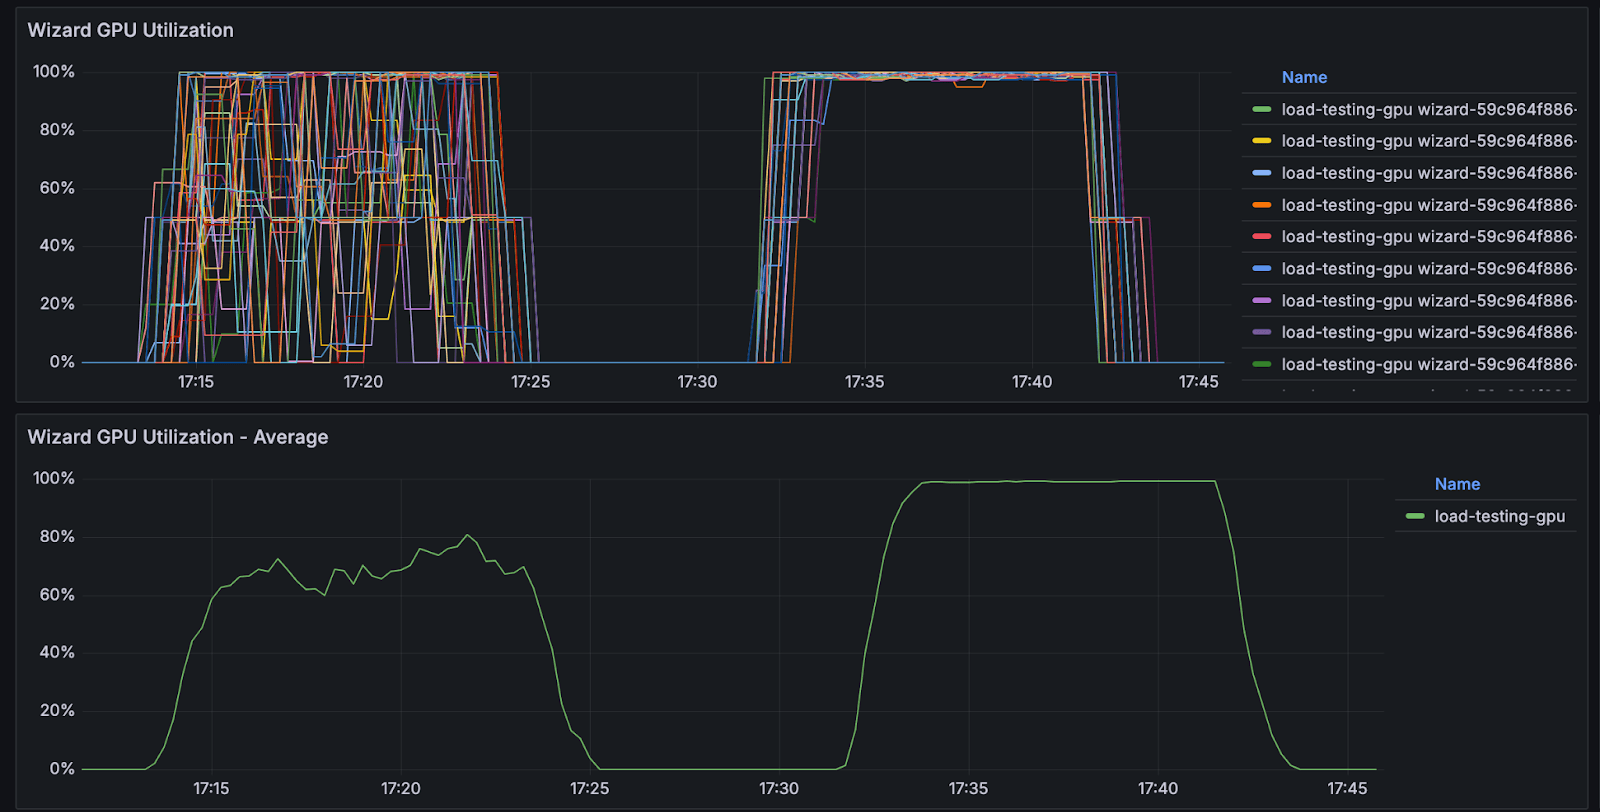 |
Left: Using default K8s load balancer |
Context
At Galileo, our Luna guardrails perform real-time LLM evaluation using a service called Wizard — a Triton inference server running multiple LoRA adapted models. Each Luna metric (e.g., Hallucination, Toxicity, PII detection) shares the same base LLM but applies different LoRA weights.
When we first deployed Wizard, we hit a wall. Despite having many expensive GPUs available, our average GPU utilization hovered around 40-60%. Even worse, individual GPUs oscillated wildly between 0% and 100% utilization within seconds.
This affected our whole service:
- Latency degradation by 2-3x under moderate load
- Occasional timeout errors as some requests waited in queues while other GPUs sat idle
- Wasted infrastructure spend — we were paying for GPU capacity we couldn't effectively use
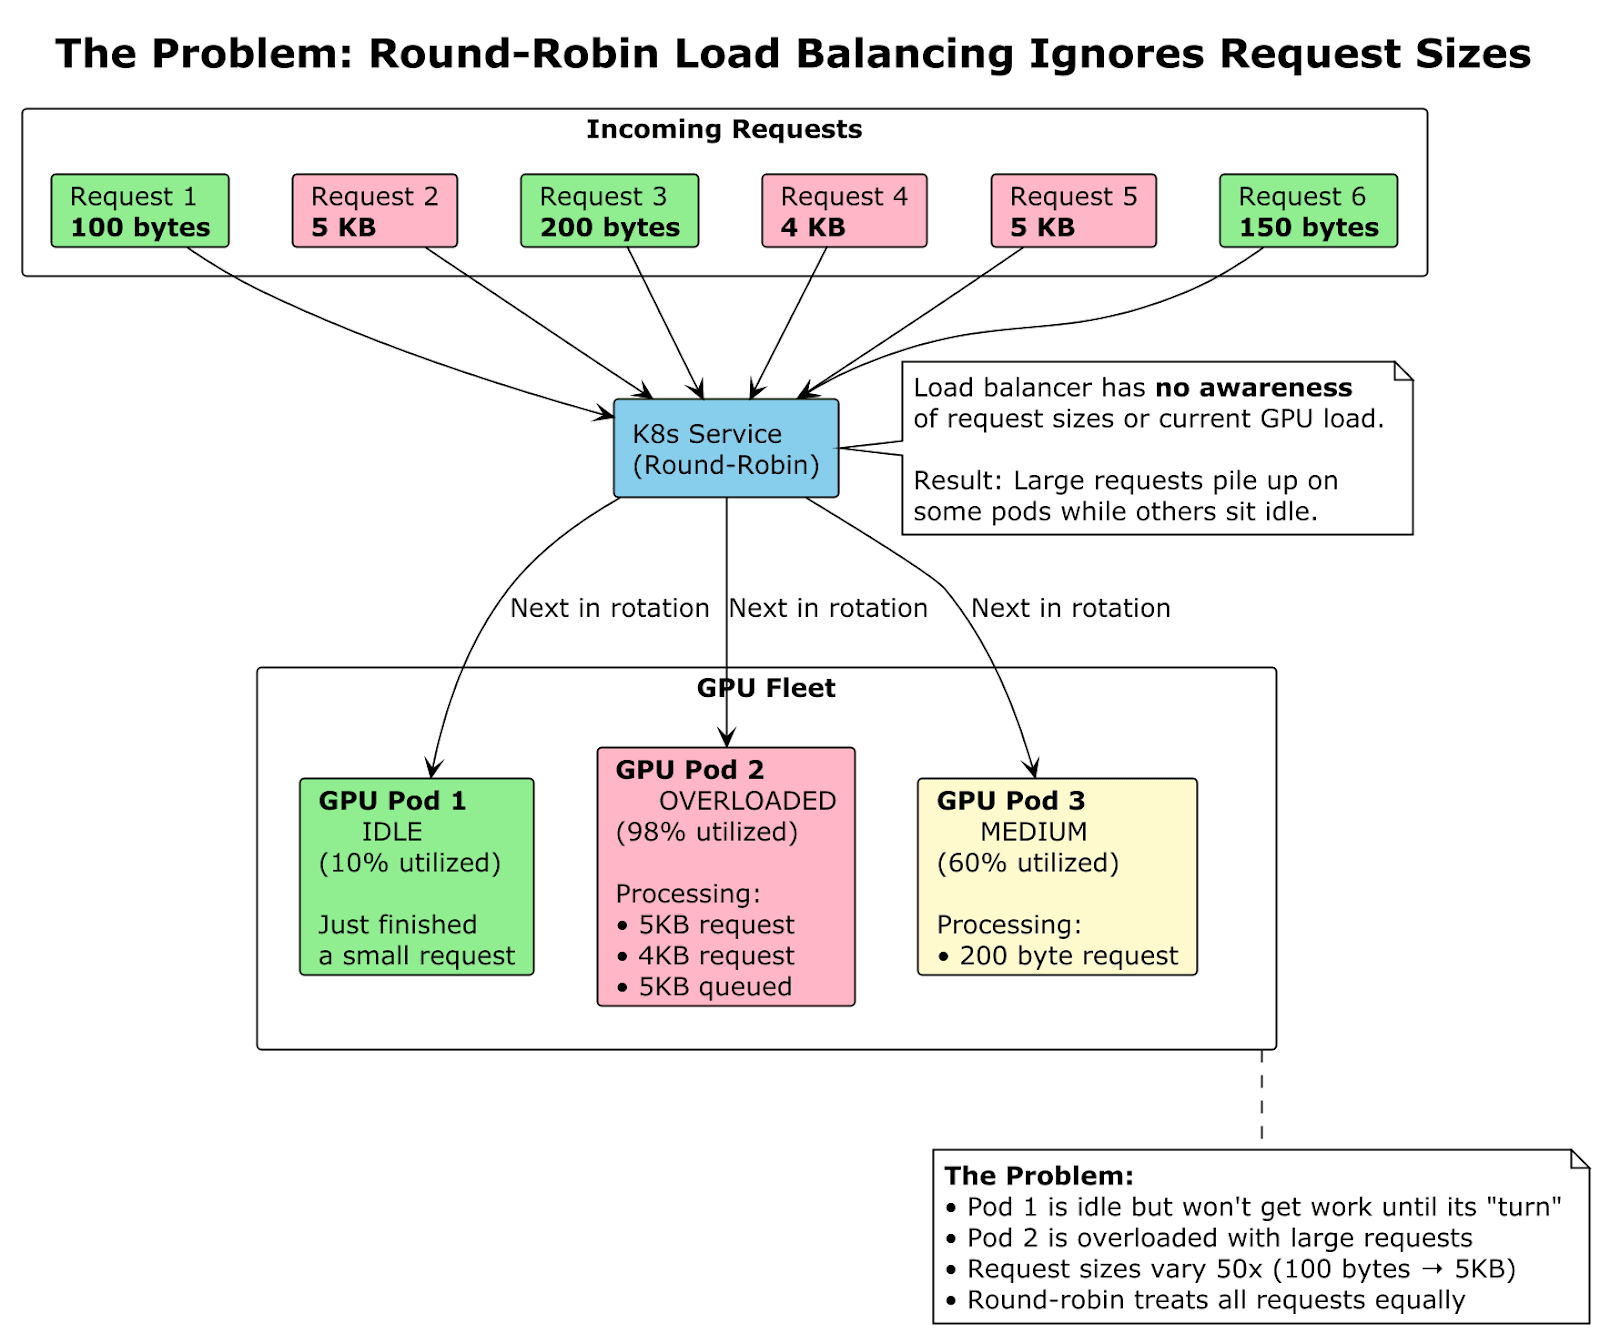
The culprit? The default Kubernetes service load balancer, which distributes requests round-robin without any awareness of actual GPU load. A 100-byte factuality check and a 5KB toxicity scan would be sent to alternating pods with equal probability, regardless of which GPU was already processing heavy workloads.
We needed a smarter approach: load-aware routing that can steer each request to the least busy GPU pod, making sure that each GPU is doing roughly the same amount of work as its peers.
This post describes how we built exactly that using client-side load balancing with Redis, achieving 40% improvement in GPU utilization and dramatically reducing tail latencies.
Why Standard Load Balancers Fail for GPU Inference
Traditional load balancers like Kubernetes' default service load balancer distribute requests based on simple connection counts or round-robin algorithms. While this works well for stateless HTTP services with predictable response times, GPU inference workloads have fundamentally different characteristics:
Highly variable execution time:
A GPU inference request processing 100 tokens might take 50ms, while a 2000-token request could take 800ms or more. This variance makes connection-based balancing ineffective.
Time varies by input size, not predictably:
Unlike traditional web services where response time is relatively consistent, GPU inference time is directly proportional to input size. The load balancer has no visibility into this.
Connection-based balancing can't account for this:
Standard load balancers see all requests as equal. They'll happily send multiple large requests to the same GPU while leaving others idle, leading to the uneven 0-100% utilization oscillation we observed.
This mismatch between traditional load balancing assumptions and GPU inference reality is why we needed a fundamentally different approach.
Why Client-Side vs Server-Side?
We considered two approaches: a centralized server-side load balancer that routes requests, or client-side logic where each client picks its own GPU. We chose client-side for several key reasons:
Lower latency: Client-side selection eliminates an extra network hop. The client can directly connect to the chosen GPU without routing through an intermediary service.
Natural failure isolation: Clients act as a natural barrier to the GPUs. If a client crashes or fails, it only affects its own requests, not the entire fleet. With a centralized load balancer, a failure becomes a single point of failure for all inference requests.
Simpler implementation: We can implement the load balancing logic in the same language (Python) as our application code, making it easier to maintain and debug. No need to deploy and manage a separate load balancing service.
Better scalability: As we add more clients, there's no bottleneck at a central service. Each client independently queries Redis and makes its own routing decision.
The main tradeoff is that each client needs visibility into the global GPU state, which is why Redis as a shared, high-performance state store is critical to making this approach work.
Computing the Load Score
A critical component of our load balancer is the cost function that estimates how much work a request will require. We chose to use the raw byte size of the inference request payload as our load score.
Payload size correlates cleanly with inference cost across all Luna models:
Uniform model architecture: All our Luna metrics use the same base LLM with only different LoRA adapters. This means inference time scales predictably with input size across all models.
No batching: Our guardrails run in real-time mode with no request batching. Each request gets immediate, dedicated GPU attention, so payload size directly correlates with execution time.
Simplicity and speed: Computing byte length is a O(1) operation with no overhead, whereas tokenization would add latency and complexity to every request routing decision.
Load-Aware Client-Side Balancing
For near-optimal balancing, we need new requests to land on the least busy GPU at the time of dispatch. If we can guarantee this, then every pod will be performing roughly the same amount of work, with no GPU pod sitting idle or overloaded. This approach also minimizes overall inference latency, which is very important for real-time guardrails.
Three constraints shaped the design:
We can maintain a real-time view into each GPU’s load.
We have a robust cost function for estimating the amount of work the GPU will do for a given input.
All inference requests have the same priority.
Having a view of clients' computing load and managing load makes it easy to ensure a consistent load view for several reasons:
Clients are a natural barrier to the GPU
We can implement logic in the same language as the rest of our app.
Bringing it all together, our algorithm looks quite simple:
Client computes the load score for inference request by using the cost function. This can be either pure byte count or number of tokens in the request.
Client picks the GPU with lowest score.
Client increments this GPU’s score by the amount computed in step 1.
Client sends inference request and waits for result.
When the response comes back, the client decrements the chosen GPU’s load score.
The implementation details that make this work reliably are where it gets interesting. Let's dive into how we use Redis and Lua scripting to make this algorithm both correct and performant.
Implementation:
Using Redis to ensure atomicity, performance and shared state
Redis is a highly performant in-memory database with various built-in data structures, which we can leverage to create a shared state for multiple clients to manage GPU load views.
Another great feature of Redis is its single-threaded nature and LUA scripting. In a nutshell, we can write LUA scripts that can execute multiple Redis commands and are guaranteed to run one at a time. This is quite powerful as we can ensure atomic operations, which is critical to creating a consistent and up-to-date load view of our GPU fleet.
Redis Data Structures
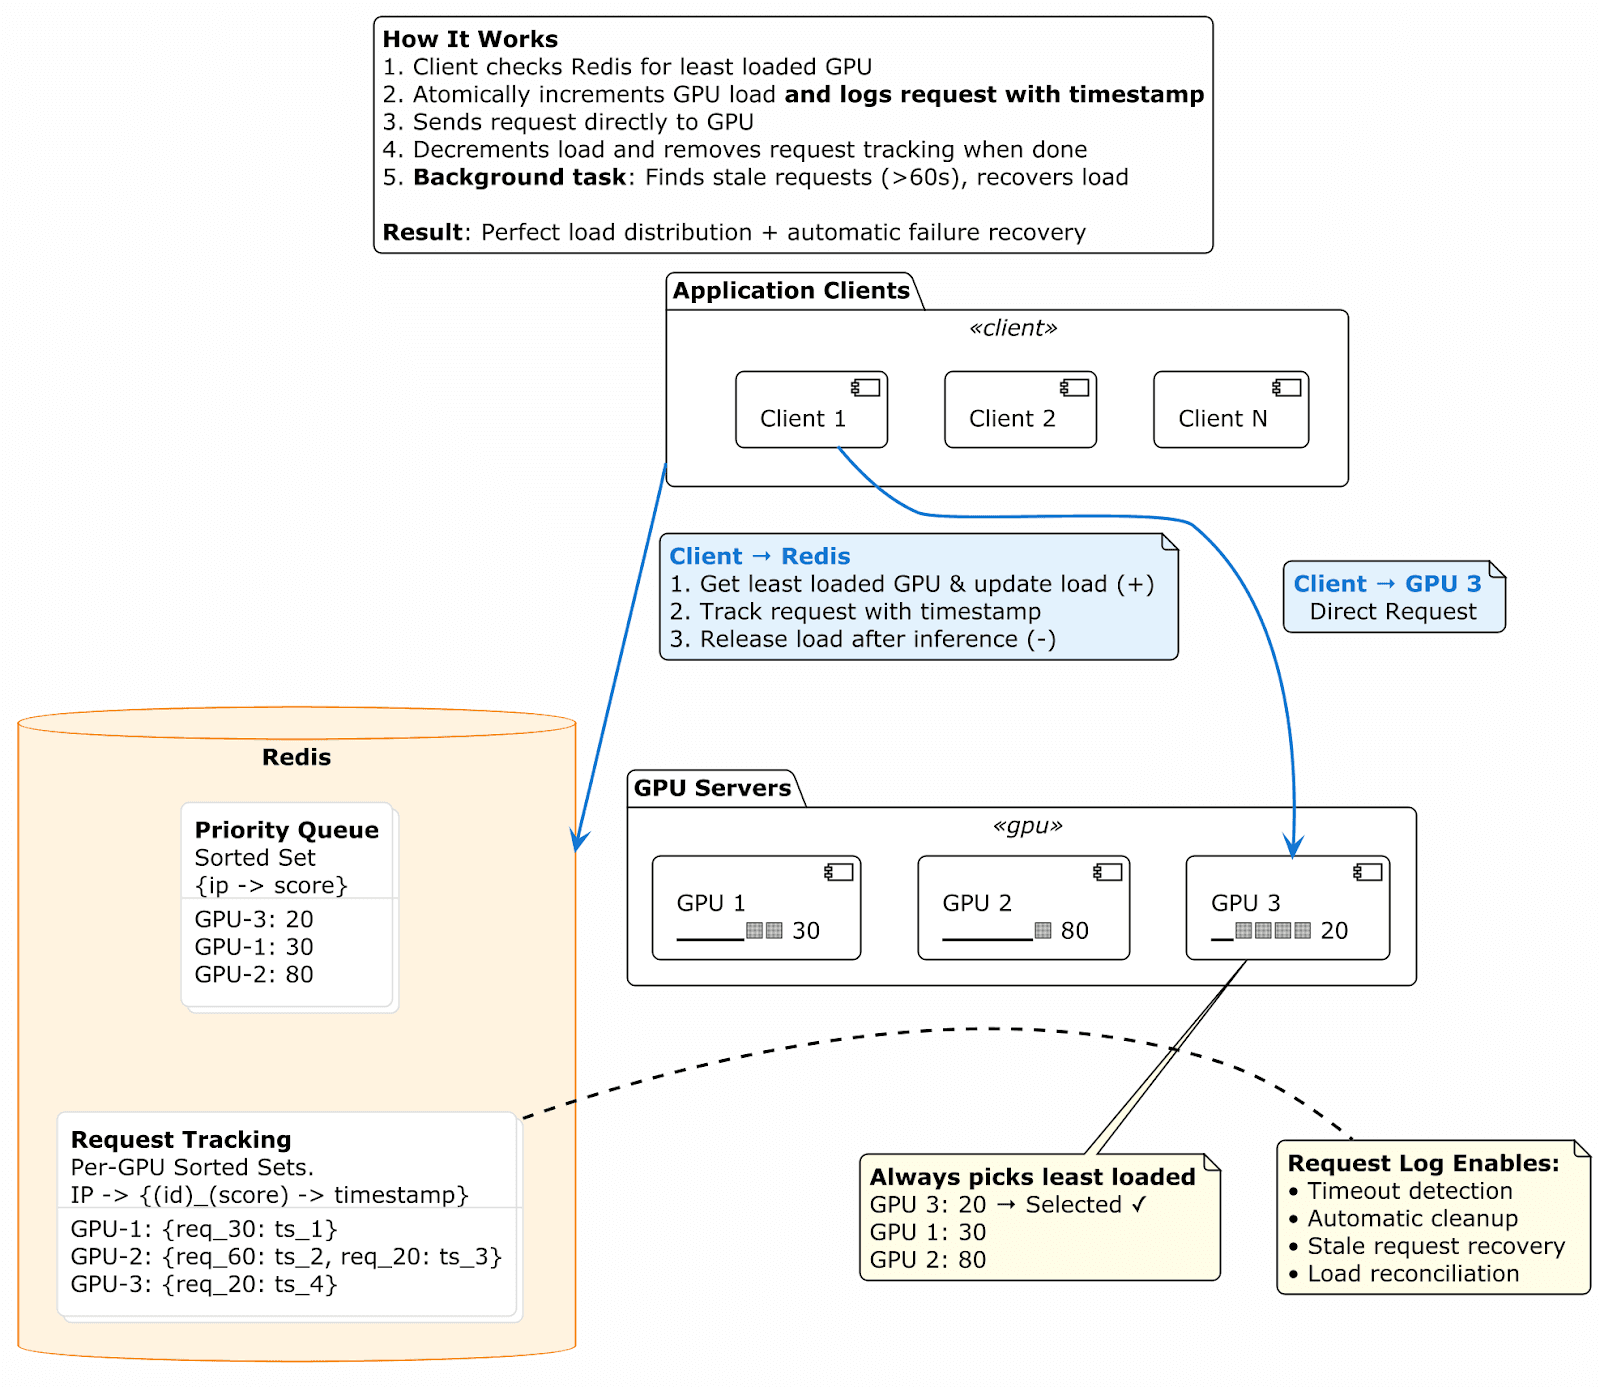
Our load balancer uses two Redis sorted sets that work together:
1. Global Priority Queue
- Members: GPU IP addresses
- Scores: Current load score (sum of all in-flight request scores)
- Purpose: Pick the least busy GPU
2. Per-GPU Request Logs
- Members: {request_id}:{load_score} (e.g., "abc-123:450")
- Scores: Request timestamp
- Purpose: Track in-flight requests and enable timeout reconciliation
Each acquire operation atomically updates both structures: incrementing the GPU's score in the priority queue and adding the request to that GPU's log. Release operations do the inverse, ensuring the load view stays accurate.
Why We Need the Request Log
In an ideal world, clients always decrement the GPU's score after getting a response. But clients can crash before releasing, leaving the score artificially inflated. The request log solves this: a background reconciler periodically scans for requests older than the timeout threshold, sums their load scores, and atomically decrements the affected GPUs' scores while removing the stale entries.
Picking Least Busy GPU Script
It’s essential for us to ensure that when we pick the least busy GPU, we also increment its score at the same time. This avoids race conditions due to multiple clients picking the least busy pod.
LUA scripting provides a simple and efficient way to do this in Redis:
-- Pick least GPU and update its score

-- KEYS[1]: priority queue key
-- ARGV[1]: load score
-- ARGV[2]: request_id
-- ARGV[3]: timestamp
-- return: Least busy GPU's ip

local load_score = ARGV[1]
local request_id = ARGV[2]
local timestamp = ARGV[3]

-- Get the first element in priority queue
local pod_ip = redis.call('ZRANGE', KEYS[1], 0, 0)[1]
-- Update the score
redis.call('ZINCRBY', KEYS[1], load_score, pod_ip)
-- Add request to request log
redis.call('ZADD', pod_ip, timestamp, request_id .. ':' .. load_score)
-- Return GPU ip to caller.
return pod_ip
Decrementing Score
We have a corollary LUA script for decrementing score and removing request from request log:
-- Release GPU

-- KEYS[1]: Priority queue key
-- ARGV[1]: pod_ip (string) - the pod to release
-- ARGV[2]: member (string) - the exact member to remove (request_id:load_score)
-- ARGV[3]: load_score (number) - the load score to decrement

local pod_ip = ARGV[1]
local member = ARGV[2]
local load_score = ARGV[3]

-- Remove request from tracking set, then decrement its score from priority queue
local r = redis.call('ZREM', pod_ip, member)

-- Only update priority queue if the request was still in the log
if r == 1 then
-- ZADD with XX flag: only updates existing members, never creates
     redis.call('ZADD', KEYS[1], 'XX', 'INCR', -tonumber(load_score), pod_ip)
end
return r
Handling GPU Fleet
GPU pods are not static. Nodes may scale up during peak load or be terminated during maintenance. We maintain a consistent view of the fleet in Redis:
Pod discovery: a lightweight job periodically lists healthy GPU pods and their IPs.
Membership updates: the job updates the Redis sorted set, adding new pods and removing ones that have disappeared.
Atomic cleanup: when removing a pod, its log and score entries are deleted in the same Lua transaction to prevent stale selections.
This keeps the priority queue aligned with the live cluster so new GPUs receive traffic as soon as they are ready and decommissioned GPUs stop receiving requests immediately.
A watch-based implementation would reduce refresh latency, but several customers restrict watches, so we intentionally use periodic refresh
Handling Pod Lifecycle Events
Pod removal during in-flight requests: When a GPU pod is removed (scaled down, crashed, or terminated), any in-flight requests to it will fail at the application level and can be retried. The requests' scores remain in the priority queue temporarily, but the next reconciler run will clean them up. Since the pod is gone, there's no risk of routing new requests to it — clients will get connection errors and fall back to the Kubernetes service.
New pod initialization: When a new GPU pod is added, it starts with a score of zero in the priority queue. It will immediately begin receiving requests, but won't be "slammed" more than other pods. Since our load view is real-time and updated on every request, the new pod's score increases naturally as it receives work, preventing overload.
Atomic membership updates: The reconciler uses a Lua script to update pod membership atomically. This prevents race conditions where a pod might be added or removed mid-request-routing, ensuring the priority queue always reflects a consistent view of the fleet.
Handling Failures
Real-world systems fail in various ways. Our load balancer handles several failure modes:
Client crashes mid-request
This is the most common failure. The client never gets a chance to decrement the GPU's score, leaving it artificially inflated.
Solution: A background reconciler runs every 30 seconds, scanning each GPU's request log for requests older than 60 seconds (our inference timeout is 5 seconds, so 60 seconds indicates a definite failure). The reconciler:
1. Identifies all stale requests for a GPU
2. Sums their load scores
3. Atomically removes them from the request log and decrements the GPU's priority queue score by the total
This ensures eventual consistency — scores may be temporarily inflated after a client crash, but are corrected within 30 seconds.
Redis unavailable
If Redis goes down or is unreachable, clients fall back to the Kubernetes service load balancer. This provides graceful degradation — we lose the optimization of load-aware routing, but inference continues working with standard round-robin distribution.
GPU pod becomes unresponsive
Kubernetes liveness probes detect unresponsive pods and remove them from the service. Our reconciler will then remove the pod from Redis on its next run, preventing new requests from being routed to it.
Thundering herd on restart
If all clients restart simultaneously and make requests, they won't all pick the same GPU thanks to the atomic Lua script execution. Each client's pick-and-increment operation is serialized by Redis, ensuring even distribution even under burst load.
Operational Details
Dynamic membership – Pods are periodically reconciled so Redis reflects the live set of GPU endpoints.
Scalability – Benchmarks show Redis Lua scripts add only a few milliseconds (10ms p99) of overhead even at thousands of QPS and hundreds of pods.
Reconciliation scripts are a bit slower, with up to 40ms p99, but since they are run asynchronously, it does not impact service performance.
Client impact – Acquire/release operations typically stay below 10 ms p99 on well-sized clients.
Results
We ran load tests using 38 A100s with various payload sizes. Negative delta means reduction in latency over using the default kubernetes load balancer.
Scenario | QPS | p50 Δ% | p90 Δ% | p99 Δ% |
Large input (8000 tok) | 50 | –50% | –71% | –73% |
Medium input (1000 tok) | 50 | –23% | –24% | –29% |
Small input (500 tok) | 50 | –21% | –20% | –27% |
The largest impact appears to happen with larger input sizes with highest delta going to higher percentiles.
Lessons Learned
Load-aware routing is one of the highest-ROI optimizations for GPU inference.
Redis’s atomic primitives and Lua scripting provide a simple yet powerful global priority queue.
Client CPU limits, not Redis, dominated end-to-end overhead in our deployments.
Next Steps
Future iterations will refine the scoring function (e.g., token-based cost models) and explore throughput-optimized modes where co-locating similar models on the same GPU may outperform strict least-load selection.
Key takeaway: When GPU inference performance hinges on micro-second decisions, pushing load balancing to the client with a fast shared state can deliver dramatic latency and utilization gains without complex infrastructure changes.
Real-time AI evaluations demand millisecond latency because any slowdown directly impacts user-facing response time. We built our Luna-2 small language models to enable exactly that: guardrails that evaluate safety without slowing down your application.
However, getting these models to perform in production required us to rethink standard load balancing. By building a load-aware client-side balancer backed by Redis, we achieved a ~40% increase in average GPU utilization and reduced tail latency by 70%. Here is how we did it.
|
Left: Using default K8s load balancer |
Context
At Galileo, our Luna guardrails perform real-time LLM evaluation using a service called Wizard — a Triton inference server running multiple LoRA adapted models. Each Luna metric (e.g., Hallucination, Toxicity, PII detection) shares the same base LLM but applies different LoRA weights.
When we first deployed Wizard, we hit a wall. Despite having many expensive GPUs available, our average GPU utilization hovered around 40-60%. Even worse, individual GPUs oscillated wildly between 0% and 100% utilization within seconds.
This affected our whole service:
- Latency degradation by 2-3x under moderate load
- Occasional timeout errors as some requests waited in queues while other GPUs sat idle
- Wasted infrastructure spend — we were paying for GPU capacity we couldn't effectively use
The culprit? The default Kubernetes service load balancer, which distributes requests round-robin without any awareness of actual GPU load. A 100-byte factuality check and a 5KB toxicity scan would be sent to alternating pods with equal probability, regardless of which GPU was already processing heavy workloads.
We needed a smarter approach: load-aware routing that can steer each request to the least busy GPU pod, making sure that each GPU is doing roughly the same amount of work as its peers.
This post describes how we built exactly that using client-side load balancing with Redis, achieving 40% improvement in GPU utilization and dramatically reducing tail latencies.
Why Standard Load Balancers Fail for GPU Inference
Traditional load balancers like Kubernetes' default service load balancer distribute requests based on simple connection counts or round-robin algorithms. While this works well for stateless HTTP services with predictable response times, GPU inference workloads have fundamentally different characteristics:
Highly variable execution time:
A GPU inference request processing 100 tokens might take 50ms, while a 2000-token request could take 800ms or more. This variance makes connection-based balancing ineffective.
Time varies by input size, not predictably:
Unlike traditional web services where response time is relatively consistent, GPU inference time is directly proportional to input size. The load balancer has no visibility into this.
Connection-based balancing can't account for this:
Standard load balancers see all requests as equal. They'll happily send multiple large requests to the same GPU while leaving others idle, leading to the uneven 0-100% utilization oscillation we observed.
This mismatch between traditional load balancing assumptions and GPU inference reality is why we needed a fundamentally different approach.
Why Client-Side vs Server-Side?
We considered two approaches: a centralized server-side load balancer that routes requests, or client-side logic where each client picks its own GPU. We chose client-side for several key reasons:
Lower latency: Client-side selection eliminates an extra network hop. The client can directly connect to the chosen GPU without routing through an intermediary service.
Natural failure isolation: Clients act as a natural barrier to the GPUs. If a client crashes or fails, it only affects its own requests, not the entire fleet. With a centralized load balancer, a failure becomes a single point of failure for all inference requests.
Simpler implementation: We can implement the load balancing logic in the same language (Python) as our application code, making it easier to maintain and debug. No need to deploy and manage a separate load balancing service.
Better scalability: As we add more clients, there's no bottleneck at a central service. Each client independently queries Redis and makes its own routing decision.
The main tradeoff is that each client needs visibility into the global GPU state, which is why Redis as a shared, high-performance state store is critical to making this approach work.
Computing the Load Score
A critical component of our load balancer is the cost function that estimates how much work a request will require. We chose to use the raw byte size of the inference request payload as our load score.
Payload size correlates cleanly with inference cost across all Luna models:
Uniform model architecture: All our Luna metrics use the same base LLM with only different LoRA adapters. This means inference time scales predictably with input size across all models.
No batching: Our guardrails run in real-time mode with no request batching. Each request gets immediate, dedicated GPU attention, so payload size directly correlates with execution time.
Simplicity and speed: Computing byte length is a O(1) operation with no overhead, whereas tokenization would add latency and complexity to every request routing decision.
Load-Aware Client-Side Balancing
For near-optimal balancing, we need new requests to land on the least busy GPU at the time of dispatch. If we can guarantee this, then every pod will be performing roughly the same amount of work, with no GPU pod sitting idle or overloaded. This approach also minimizes overall inference latency, which is very important for real-time guardrails.
Three constraints shaped the design:
We can maintain a real-time view into each GPU’s load.
We have a robust cost function for estimating the amount of work the GPU will do for a given input.
All inference requests have the same priority.
Having a view of clients' computing load and managing load makes it easy to ensure a consistent load view for several reasons:
Clients are a natural barrier to the GPU
We can implement logic in the same language as the rest of our app.
Bringing it all together, our algorithm looks quite simple:
Client computes the load score for inference request by using the cost function. This can be either pure byte count or number of tokens in the request.
Client picks the GPU with lowest score.
Client increments this GPU’s score by the amount computed in step 1.
Client sends inference request and waits for result.
When the response comes back, the client decrements the chosen GPU’s load score.
The implementation details that make this work reliably are where it gets interesting. Let's dive into how we use Redis and Lua scripting to make this algorithm both correct and performant.
Implementation:
Using Redis to ensure atomicity, performance and shared state
Redis is a highly performant in-memory database with various built-in data structures, which we can leverage to create a shared state for multiple clients to manage GPU load views.
Another great feature of Redis is its single-threaded nature and LUA scripting. In a nutshell, we can write LUA scripts that can execute multiple Redis commands and are guaranteed to run one at a time. This is quite powerful as we can ensure atomic operations, which is critical to creating a consistent and up-to-date load view of our GPU fleet.
Redis Data Structures
Our load balancer uses two Redis sorted sets that work together:
1. Global Priority Queue
- Members: GPU IP addresses
- Scores: Current load score (sum of all in-flight request scores)
- Purpose: Pick the least busy GPU
2. Per-GPU Request Logs
- Members: {request_id}:{load_score} (e.g., "abc-123:450")
- Scores: Request timestamp
- Purpose: Track in-flight requests and enable timeout reconciliation
Each acquire operation atomically updates both structures: incrementing the GPU's score in the priority queue and adding the request to that GPU's log. Release operations do the inverse, ensuring the load view stays accurate.
Why We Need the Request Log
In an ideal world, clients always decrement the GPU's score after getting a response. But clients can crash before releasing, leaving the score artificially inflated. The request log solves this: a background reconciler periodically scans for requests older than the timeout threshold, sums their load scores, and atomically decrements the affected GPUs' scores while removing the stale entries.
Picking Least Busy GPU Script
It’s essential for us to ensure that when we pick the least busy GPU, we also increment its score at the same time. This avoids race conditions due to multiple clients picking the least busy pod.
LUA scripting provides a simple and efficient way to do this in Redis:
-- Pick least GPU and update its score

-- KEYS[1]: priority queue key
-- ARGV[1]: load score
-- ARGV[2]: request_id
-- ARGV[3]: timestamp
-- return: Least busy GPU's ip

local load_score = ARGV[1]
local request_id = ARGV[2]
local timestamp = ARGV[3]

-- Get the first element in priority queue
local pod_ip = redis.call('ZRANGE', KEYS[1], 0, 0)[1]
-- Update the score
redis.call('ZINCRBY', KEYS[1], load_score, pod_ip)
-- Add request to request log
redis.call('ZADD', pod_ip, timestamp, request_id .. ':' .. load_score)
-- Return GPU ip to caller.
return pod_ip
Decrementing Score
We have a corollary LUA script for decrementing score and removing request from request log:
-- Release GPU

-- KEYS[1]: Priority queue key
-- ARGV[1]: pod_ip (string) - the pod to release
-- ARGV[2]: member (string) - the exact member to remove (request_id:load_score)
-- ARGV[3]: load_score (number) - the load score to decrement

local pod_ip = ARGV[1]
local member = ARGV[2]
local load_score = ARGV[3]

-- Remove request from tracking set, then decrement its score from priority queue
local r = redis.call('ZREM', pod_ip, member)

-- Only update priority queue if the request was still in the log
if r == 1 then
-- ZADD with XX flag: only updates existing members, never creates
     redis.call('ZADD', KEYS[1], 'XX', 'INCR', -tonumber(load_score), pod_ip)
end
return r
Handling GPU Fleet
GPU pods are not static. Nodes may scale up during peak load or be terminated during maintenance. We maintain a consistent view of the fleet in Redis:
Pod discovery: a lightweight job periodically lists healthy GPU pods and their IPs.
Membership updates: the job updates the Redis sorted set, adding new pods and removing ones that have disappeared.
Atomic cleanup: when removing a pod, its log and score entries are deleted in the same Lua transaction to prevent stale selections.
This keeps the priority queue aligned with the live cluster so new GPUs receive traffic as soon as they are ready and decommissioned GPUs stop receiving requests immediately.
A watch-based implementation would reduce refresh latency, but several customers restrict watches, so we intentionally use periodic refresh
Handling Pod Lifecycle Events
Pod removal during in-flight requests: When a GPU pod is removed (scaled down, crashed, or terminated), any in-flight requests to it will fail at the application level and can be retried. The requests' scores remain in the priority queue temporarily, but the next reconciler run will clean them up. Since the pod is gone, there's no risk of routing new requests to it — clients will get connection errors and fall back to the Kubernetes service.
New pod initialization: When a new GPU pod is added, it starts with a score of zero in the priority queue. It will immediately begin receiving requests, but won't be "slammed" more than other pods. Since our load view is real-time and updated on every request, the new pod's score increases naturally as it receives work, preventing overload.
Atomic membership updates: The reconciler uses a Lua script to update pod membership atomically. This prevents race conditions where a pod might be added or removed mid-request-routing, ensuring the priority queue always reflects a consistent view of the fleet.
Handling Failures
Real-world systems fail in various ways. Our load balancer handles several failure modes:
Client crashes mid-request
This is the most common failure. The client never gets a chance to decrement the GPU's score, leaving it artificially inflated.
Solution: A background reconciler runs every 30 seconds, scanning each GPU's request log for requests older than 60 seconds (our inference timeout is 5 seconds, so 60 seconds indicates a definite failure). The reconciler:
1. Identifies all stale requests for a GPU
2. Sums their load scores
3. Atomically removes them from the request log and decrements the GPU's priority queue score by the total
This ensures eventual consistency — scores may be temporarily inflated after a client crash, but are corrected within 30 seconds.
Redis unavailable
If Redis goes down or is unreachable, clients fall back to the Kubernetes service load balancer. This provides graceful degradation — we lose the optimization of load-aware routing, but inference continues working with standard round-robin distribution.
GPU pod becomes unresponsive
Kubernetes liveness probes detect unresponsive pods and remove them from the service. Our reconciler will then remove the pod from Redis on its next run, preventing new requests from being routed to it.
Thundering herd on restart
If all clients restart simultaneously and make requests, they won't all pick the same GPU thanks to the atomic Lua script execution. Each client's pick-and-increment operation is serialized by Redis, ensuring even distribution even under burst load.
Operational Details
Dynamic membership – Pods are periodically reconciled so Redis reflects the live set of GPU endpoints.
Scalability – Benchmarks show Redis Lua scripts add only a few milliseconds (10ms p99) of overhead even at thousands of QPS and hundreds of pods.
Reconciliation scripts are a bit slower, with up to 40ms p99, but since they are run asynchronously, it does not impact service performance.
Client impact – Acquire/release operations typically stay below 10 ms p99 on well-sized clients.
Results
We ran load tests using 38 A100s with various payload sizes. Negative delta means reduction in latency over using the default kubernetes load balancer.
Scenario | QPS | p50 Δ% | p90 Δ% | p99 Δ% |
Large input (8000 tok) | 50 | –50% | –71% | –73% |
Medium input (1000 tok) | 50 | –23% | –24% | –29% |
Small input (500 tok) | 50 | –21% | –20% | –27% |
The largest impact appears to happen with larger input sizes with highest delta going to higher percentiles.
Lessons Learned
Load-aware routing is one of the highest-ROI optimizations for GPU inference.
Redis’s atomic primitives and Lua scripting provide a simple yet powerful global priority queue.
Client CPU limits, not Redis, dominated end-to-end overhead in our deployments.
Next Steps
Future iterations will refine the scoring function (e.g., token-based cost models) and explore throughput-optimized modes where co-locating similar models on the same GPU may outperform strict least-load selection.
Key takeaway: When GPU inference performance hinges on micro-second decisions, pushing load balancing to the client with a fast shared state can deliver dramatic latency and utilization gains without complex infrastructure changes.

Lev Neiman