
The Observability Playbook That Cuts AI Agent Costs Without Sacrificing Quality

Ever notice how your LLM bill keeps climbing even when usage stays flat? The invoice never explains why. One day your customer-support bot costs pennies, the next day a multi-agent workflow quietly drains thousands through hidden retries, oversized context windows, and redundant tool calls.
You respond with random prompt tweaks or model downgrades because you can't see what's actually driving costs.
This is where agent observability steps in. When you track every request, trace, and token, you see exactly which agent step, prompt version, or external API call eats your budget. This guide shows you practical, data-driven tactics that can slash your costs even as your agent systems grow more complex.
We recently explored this topic on our Chain of Thought podcast, where industry experts shared practical insights and real-world implementation strategies:
What Drives AI Agent Costs in LLM-Based Systems?
Even if you track basic usage metrics, the real cost drivers inside an agentic LLM workflow often stay hidden. Here are six patterns that explain where your money vanishes—and why costs explode the moment your agents move from demo to production.
Token usage, context management, and multi-step agent workflows
Your agent builds conversations. Each interaction adds prior turns, re-injects summaries, and includes chain-of-thought reasoning at every step. That expanding context window grows linearly, but you pay for every single token. The math is simple: more words = bigger bill.
Feeding full documents instead of relevant snippets quickly maxes out context limits and inflates costs without improving answers. When your five-turn conversation hits 8k tokens, you're paying more to repeat past context than for fresh thinking.
Tool calling overhead and external API costs
Think "tokens = cost"? Not quite.
Every time your agent calls a tool—search, database, vector store—you pay twice: once for the tokens packaging the request, then again for the external API fee. As your agent chains multiple tools together, those external costs can dwarf your model expenses.
Reasoning loop iterations (ReAct, CoT patterns)
ReAct and CoT loops improve accuracy by letting your model think step-by-step, but each reflection doubles the prompt size as old thoughts become new context. A five-step ReAct loop uses roughly 10× the tokens of a direct answer. Better thinking costs more—unless you cap iterations before they spiral out of control.
Multi-agent coordination and message passing
Splitting jobs across specialist agents seems efficient until you see what coordination costs. Each agent receives context, adds its own reasoning, and passes a longer message downstream. Production analysis shows cases where coordination chatter increased token counts by 4× compared to single-agent approaches.
Complex systems don't just multiply efficiency—they multiply your invoice too.
Failure/retry cascades in agentic workflows
When tool calls return malformed JSON or hallucinated URLs, many orchestrators simply retry. Without visibility, one bad response can trigger loops of regenerations burning through tokens and API credits.
Anomaly reports regularly spot spikes where silent retry storms tripled hourly spend before anyone noticed.
Other common sources of unnecessary spend
Verbose system prompts, oversized models, and redundant context padding top the waste list. Trimming boilerplate instructions often cuts prompt size with zero quality loss. Add missing caching, unnecessary model upgrades, and duplicate API calls, and you're burning money.
Agent and LLM observability reveals these leaks so you can fix them before your next bill arrives.
How does AI Agent observability reduce LLM costs?
You can't shrink a bill you can't see. Without clear instrumentation, agent charges pile up invisibly—hidden inside sprawling prompts, cascading retries, or endless chat histories. Observability turns every token, API call, and reasoning step into a datapoint you can analyze, track, and optimize.
What is observability for AI agents and LLM systems?
Agent observability provides complete visibility into how your AI systems operate, tracking every token, decision, and interaction. Your agents mysteriously fail, costs spike overnight, and you're left guessing what broke your budget. Traditional monitoring catches downtime but misses the subtle behaviors draining your wallet.
Agent observability captures structured logs, detailed metrics, and traces from every request. You see which prompt version, model tier, and context slice produced each response—and what it cost.
Telemetry gateways funnel this data into central repositories for immediate analysis. This visibility transforms random tweaking into evidence-based cost engineering.
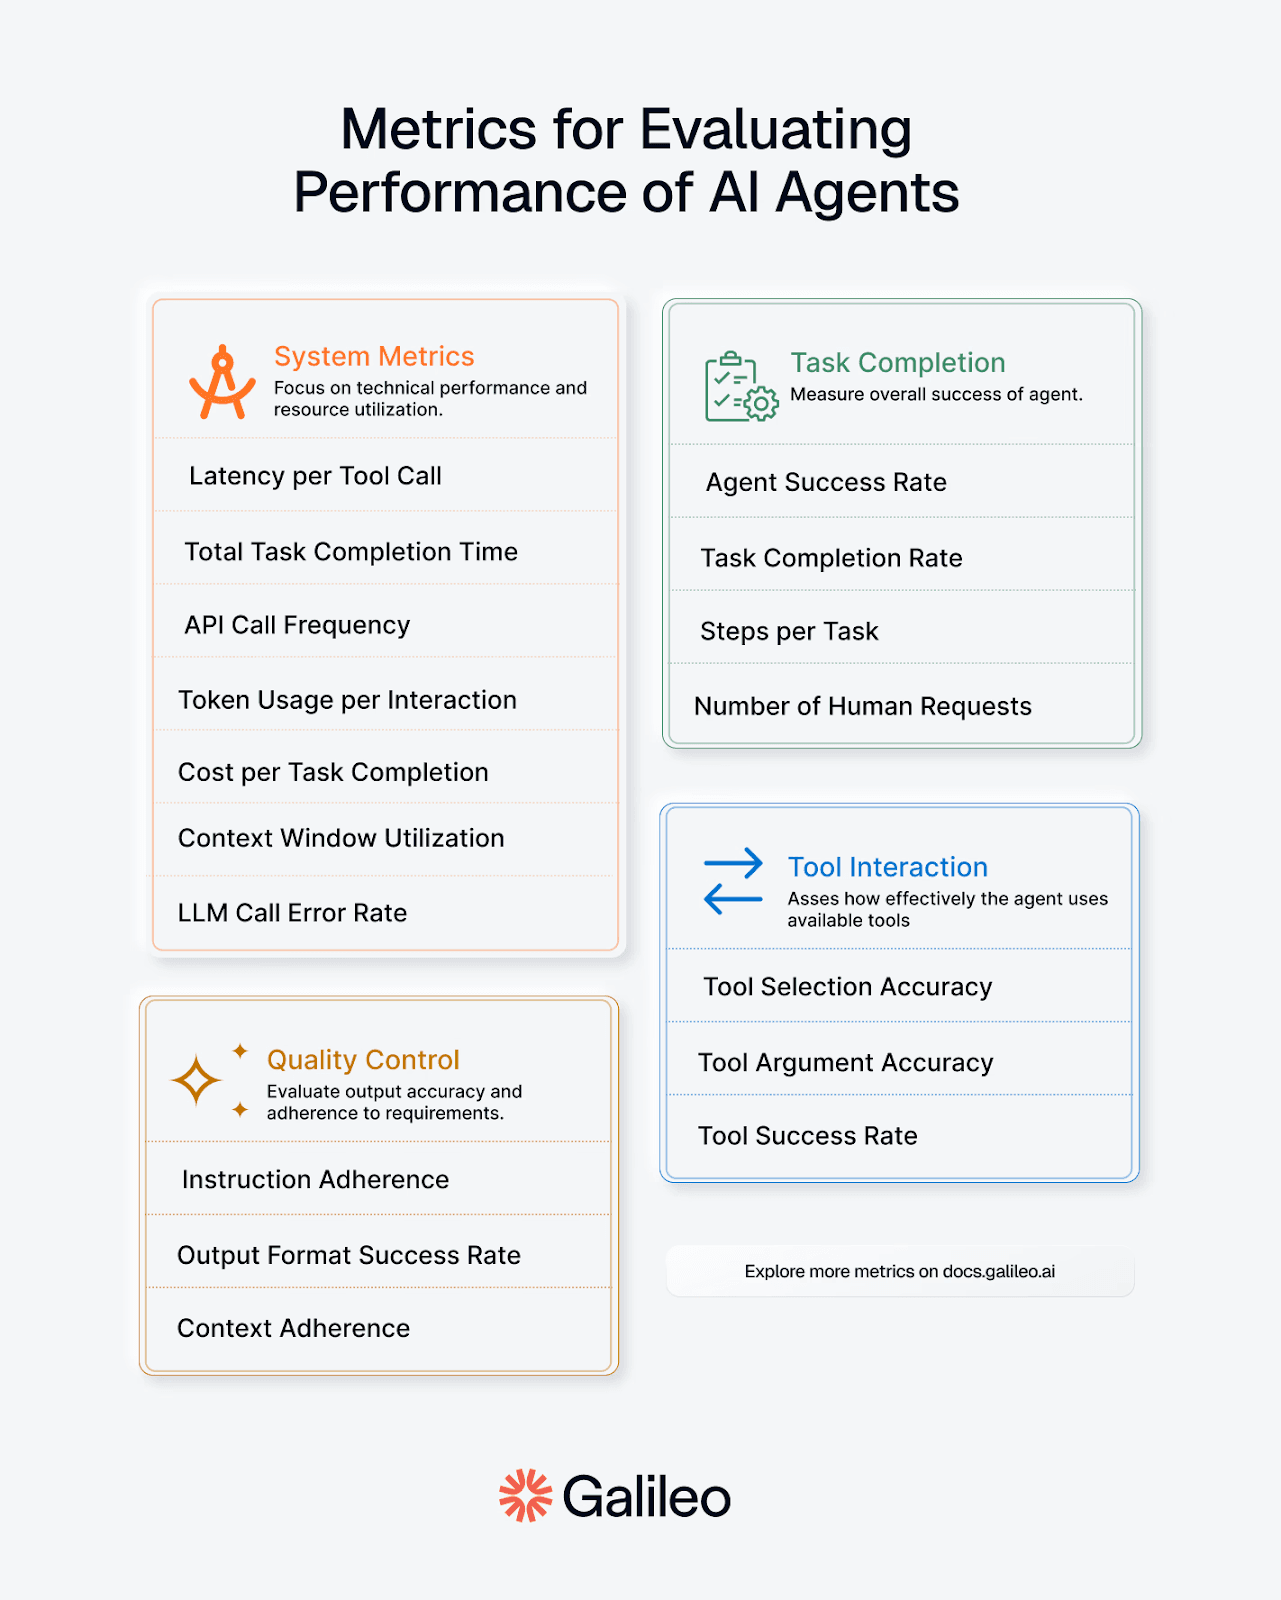
Key agent observability metrics
Key agent observability metrics that help identify cost drivers in your production systems:
Token consumption counters: Track input and output token usage per request, instantly spotting runaway prompts before they drain your budget
Decision-tree visualizations: Map which workflow branches consume the most tokens, revealing expensive patterns and dead-end reasoning loops
Tool call frequency: Measure how often agents invoke external tools and APIs, exposing hidden costs beyond token usage
Context window size: Monitor how much context your agents carry between turns, identifying bloat that multiplies token costs unnecessarily
Latency measurements: Connect slow response times to cost implications, as lengthy generations often indicate inefficient prompting
Retry rates: Track failed requests and automatic retries that silently multiply costs without delivering additional value
Model drift indicators: Detect when your agent's performance degrades over time, leading to more expensive correction attempts
API failure rates: Track failed requests and retry cascades that silently multiply costs. Spikes above 5% signal misconfigurations, burning budget through the error-handling loop, and aggregate metrics miss.
Request volume patterns: Traffic spikes with rising costs mean capacity problems. Traffic flat with rising costs means efficiency is degraded. The pattern tells you which fire to fight.
Cache hit ratios: Every cache hit is a request you didn't pay for. Rates above 40% prove caching works; below 20% means tune similarity thresholds or extend TTL to capture more savings.
These metrics work together to provide a comprehensive view of your agent's cost profile and optimization opportunities.
Modern agents trigger web searches, database queries, and multiple LLM calls per request. Agent observability breaks each hop into its own cost line. Monitoring approaches display tool-call frequency alongside per-call expenses, showing when search plugins cost more than the core model.
Traces also reveal reasoning depth variations: three ReAct iterations versus ten. When accuracy plateaus after the fourth step, you can cap iterations and cut your bill significantly.
Real-time cost mapping converts every token into dollars as calls complete. Anomaly detection catches the warning signs: context windows jumping 40% or tool invocations tripling within an hour. Slack alerts fire before invoices skyrocket.
This immediate feedback lets you roll back problematic code before finance sees the damage.
How can you use AI Agent observability to uncover cost patterns?
Raw invoices show totals, not causes; observability reveals the hidden patterns driving your spend. By instrumenting each request and analyzing agent behaviors systematically, you turn opaque billing surprises into clear optimization opportunities.
Surfacing hidden cost patterns through instrumentation
Basic error logs miss the real spend drivers. Without instrumentation, you're debugging cost overruns blind. Route every LLM request through a gateway to capture prompt, token count, model, and user tags in one trace.
Distributed tracing follows requests across agents and tool calls, exposing hidden context injections and silent retries. Time-stamped charts reveal nightly spikes or month-end surges that aggregate bills never show.
Identifying high-cost agent behaviors and bottlenecks
Which agent behaviors actually drive your costs? Granular attribution provides the answer.
Tag each span with agent, step, and tool; costly patterns become visible: search tools firing triple queries, planning loops injecting unused summaries, prompts doubling output tokens unnecessarily. Cost-per-span sorting puts your worst offenders first, making optimization targets obvious.
Correlating performance metrics with spend
How do you balance cost cuts against quality requirements? Raw savings mean nothing if performance tanks.
Link cost traces to latency, success rate, and drift metrics so you see both sides of every optimization decision. Scatter plots keep these compromises transparent and prevent you from chasing savings that destroy value.
Automated insights that catch waste before you do
Manual trace review misses patterns burning budget quietly. Your Plan Advisor agent made three separate knowledge base calls per conversation for two weeks—$152 monthly in redundant retrievals nobody noticed.
Automated detection flags it immediately: "Batch these calls." Deploy the fix, watch $152 monthly waste disappear.
Same pattern with context bloat. Analysis shows only recent exchanges matter, but you're dragging full history through every turn. Progressive summarization cuts tokens 35% with zero quality loss.
You check samples. The system analyzes everything. That's the difference.
Best Practices for Optimizing AI Agent Costs
Rising token bills creep in through verbose prompts, oversized models, and hidden agent reasoning—until the invoice hits. By adding observability to each stage of your workflow, you replace guesswork with hard data and repeatable strategies.
Instrument your agent framework for cost visibility
Your agents fail in expensive ways, leaving you staring at token bills that doubled overnight. Most teams try retroactive cost analysis, wasting hours without finding root causes. Building in granular logging from day one solves this mystery.
Start by routing every LLM call through a custom callback or an observability integration like Galileo's callback, which can record input and output token counts, latency, and model name. LangChain exposes callback hooks, but detailed structured logging requires a custom or third-party callback.
Stream these events to a centralized gateway. Once requests are tagged with user, agent, and feature metadata, platforms like Helicone let you slice spend by any dimension and spot runaway queries before they compound.
Trace agent execution paths to identify bottlenecks
Production agents make thousands of reasoning steps daily, yet traditional monitoring misses the decision paths burning budget. Distributed tracing reveals the truth—assign trace IDs at the endpoint, follow every step through the workflow, and see where money disappears.
LLM operations eating 80% of latency? Inference is your budget bleeder, not retrieval. Sequential operations that should run in parallel? You're leaving money on the table. Latency spikes from retry loops? Agents burning tokens in circles before giving up.
Tool usage patterns matter too. Sparse calls mean smart decisions. Dense clusters mean unnecessary API fees.
Quick fixes: Add prompt caching for repeated context. Route simple decisions to cheaper models. Set aggressive timeouts to fail fast instead of accumulating charges.
Visual traces quantify exactly how much each problem costs.
Reduce context windows with smart memory management
Feeding whole transcripts into every call kills budgets fast. Progressive summarization keeps only what matters. Maintain conversation flow by storing summaries in vector memory and appending a rolling window of the last two exchanges.
This selective context approach trims token counts without lowering answer relevance. Measure impact directly—if average tokens per request fall yet success metrics hold steady, you've found free savings.
Right-size models based on task complexity
Why use GPT-4 for "What are your hours?" when GPT-3.5 costs 90% less? Many teams default to flagship models for all traffic, yet lighter models handle 70% of typical queries at a fraction of the price.
Observability data pinpoints low-perplexity requests that still score high on quality checks. Route those calls to smaller backbones and reserve premium capacity for edge cases.
Engineer prompts to minimize token usage
Verbose system messages quietly drain budgets while teams focus on model costs.
Compare: "Please provide a detailed summary…" (36 tokens) versus "Summarize:" (2 tokens). Smart prompt engineering uses numbered constraints and explicit output schemas instead of flowery instructions. Test revisions with A/B splits and watch token curves bend downward in real time.
Small changes compound—trimming 20 tokens per request saves thousands monthly at scale.
Implement caching and RAG to reduce repeat calls
You handle duplicate questions every hour, yet most systems regenerate identical answers. Semantic caching stores previous responses keyed by embedding similarity; identical intents never hit the model again.
For longer documents, Retrieval-Augmented Generation injects only relevant snippets, cutting context bloat. Track cache hit ratios alongside cost metrics to fine-tune eviction policies.
Set up automated cost alerts and budget limits
Sudden token spikes appear outside office hours when no one's watching. Real-time anomaly detection solves that blindspot.
Configure spend thresholds per project; when requests exceed baseline by 3x median token count, trigger Slack alerts and optionally throttle traffic. Instant notifications prevent marketing bots from incurring five-figure bills during prompt-injection tests.
Build guardrails before you need them.
Deploy dashboards for real-time cost tracking
Dashboards turn raw logs into shared understanding across teams. Expose cost per agent action, token trends over time, tool call frequency, and model mix.
Any Grafana or Kibana board works once data is structured properly. When leadership sees cost curves flatten after optimization sprints, funding for the next iteration becomes an easy sell.
Make spending visible to make it manageable.
A/B test optimization changes to validate savings
Rolling new prompts or routing rules to everyone is risky. Divert 10% of traffic and compare metrics first.
Split flows by header to chart cost, latency, and quality side by side. If variant B saves 35% tokens with less than 2% quality regression, promote it confidently. If not, scrap it without impact.
Data beats intuition every time.
Build feedback loops to continuously optimize costs
Token economics shift as usage patterns evolve. Without systematic reviews, yesterday's optimization becomes tomorrow's cost leak.
Daily (5 minutes): Check your 12-hour view. Token usage jumped 30%? API calls spiked without traffic? Filter to the spike window, identify which agent changed, fix before costs compound.
Weekly (30 minutes): Export highest-cost traces. Spot patterns—expensive queries, inefficient agents, changes that shuffled costs instead of reducing them. Document, ticket, fix next sprint.
Monthly (1 hour): Snapshot baselines before major changes. Did that model upgrade justify 10× costs? Did the new agent reduce spend or add overhead? Document results for budget discussions.
Prototype fixes Monday, measure Friday. Continuous 5-10% monthly improvements beat quarterly overhauls. Make optimization a habit, not a crisis response.
Integrate cost guardrails into your CI/CD pipeline
Release days shouldn't feel like gambling with your budget. Observability pipelines inject cost regression tests into build stages. Fail builds if new prompts push mean tokens per request above defined budgets, or if model changes raise per-call cost by more than 5%.
Catching regressions pre-deploy beats firefighting them in production—and finance teams appreciate the predictability.
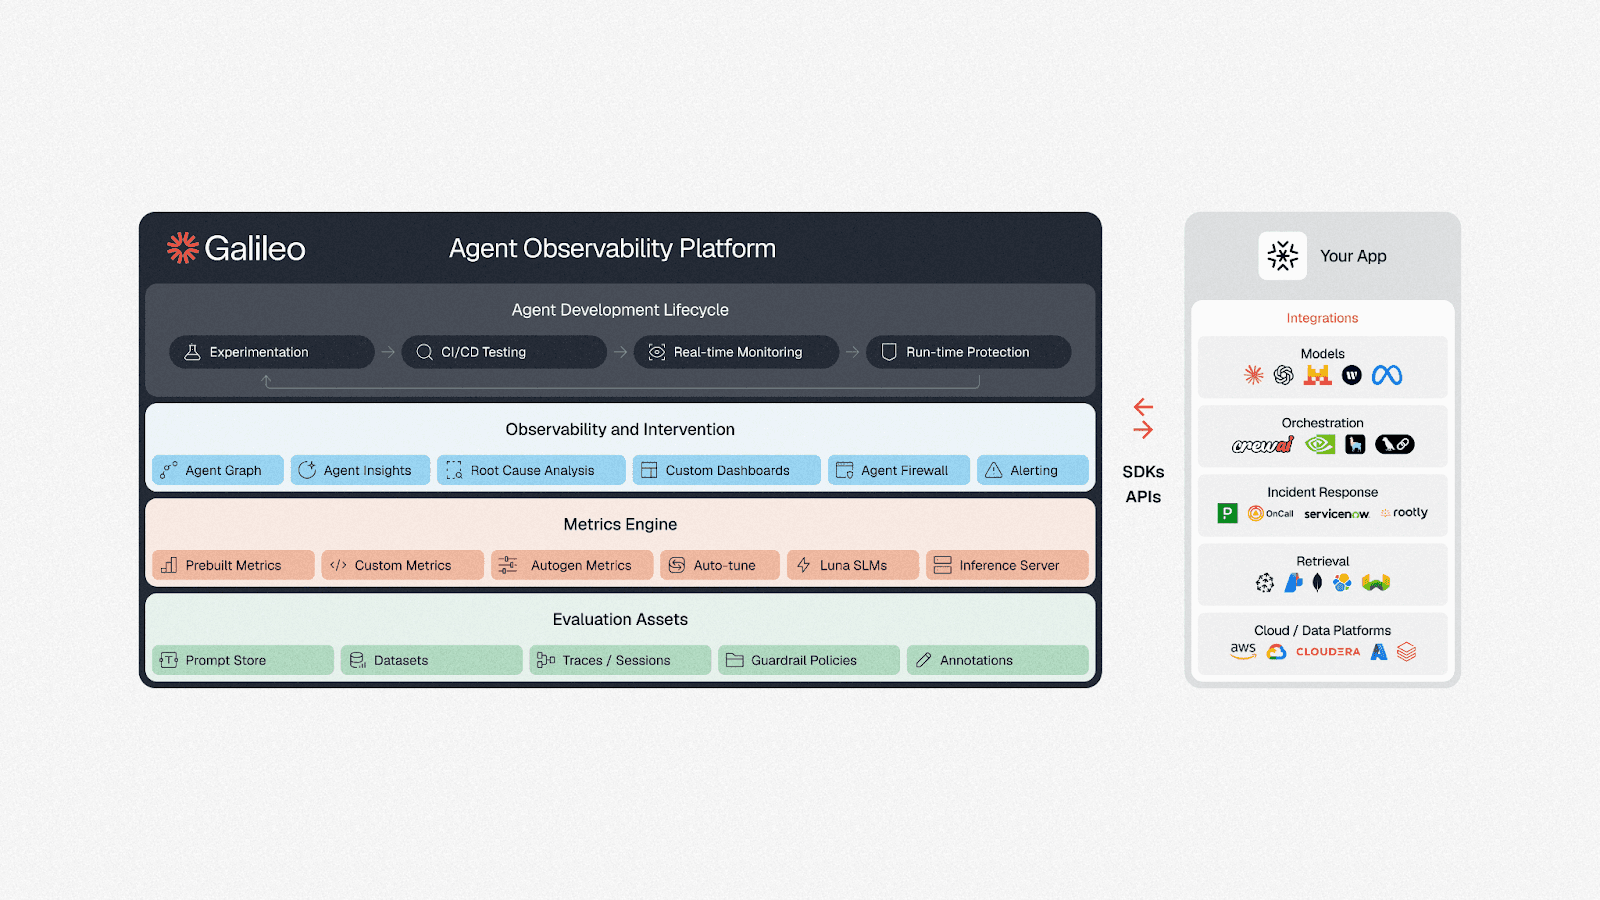
Eliminate AI Agent Budget Overruns with Purpose-Built Observability
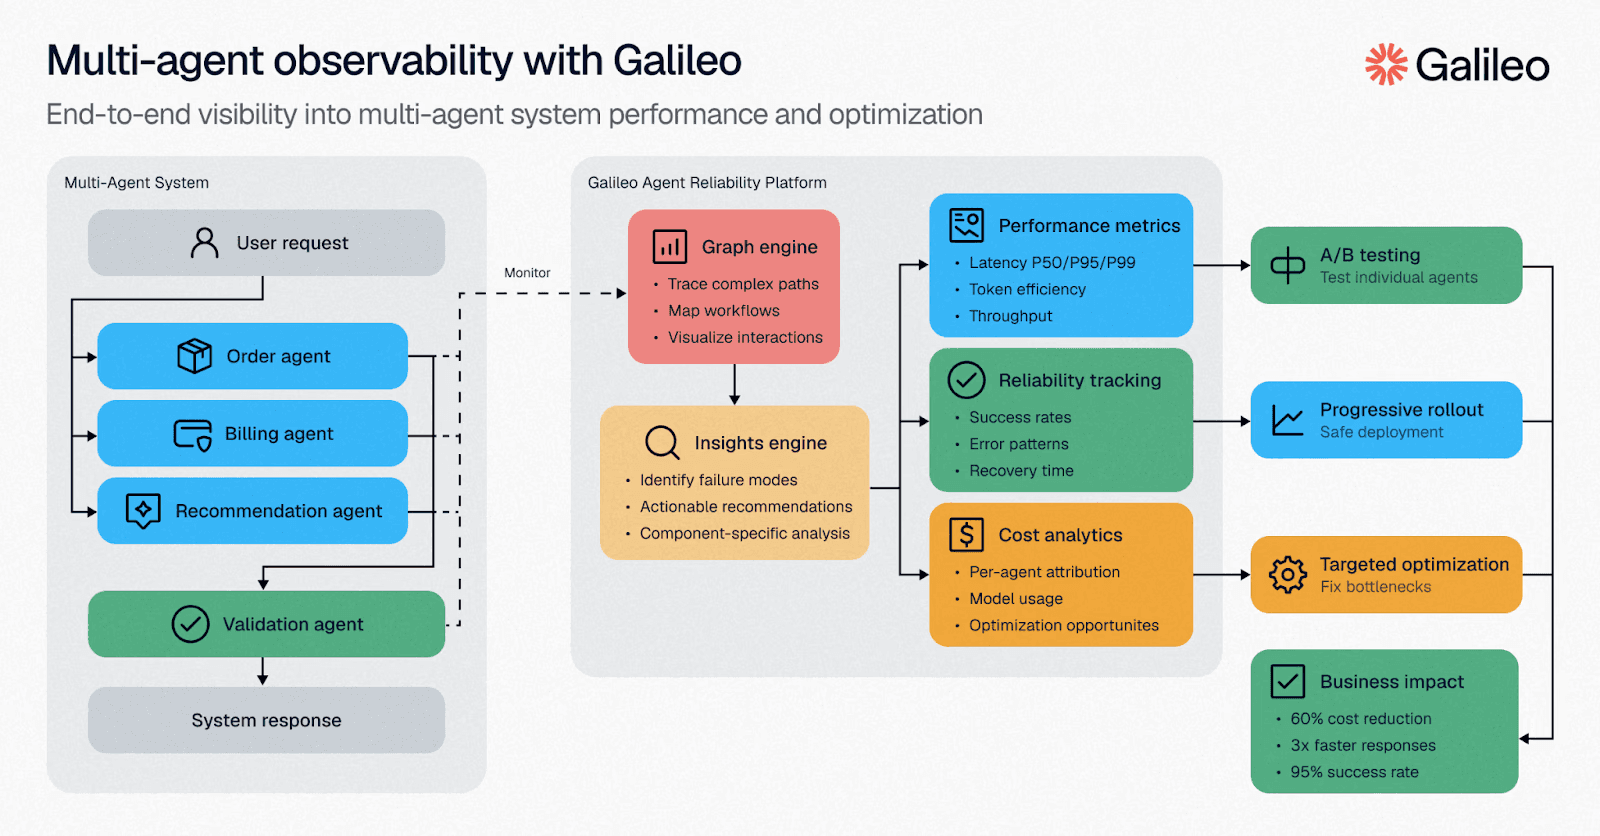
Purpose-built agent observability platforms like Galileo transform cost management from guesswork to precision engineering. Here’s how Galileo wraps evaluation, tracing, and guardrailing into a single cohesive workflow:
Automated quality guardrails in CI/CD: Galileo integrates directly into your development workflow, running comprehensive evaluations on every code change and blocking releases that fail quality thresholds
Multi-dimensional response evaluation: With Galileo's Luna-2 Small Language models, you can assess every output across dozens of quality dimensions—correctness, toxicity, bias, adherence—at 97% lower cost than traditional LLM-based evaluation approaches
Real-time runtime protection: Galileo's Agent Protect scans every prompt and response in production, blocking harmful outputs before they reach users while maintaining detailed compliance logs for audit requirements
Intelligent failure detection: Galileo’s Insights Engine automatically clusters similar failures, surfaces root-cause patterns, and recommends fixes, reducing debugging time while building institutional knowledge
Human-in-the-loop optimization: Galileo's Continuous Learning via Human Feedback (CLHF) transforms expert reviews into reusable evaluators, accelerating iteration while maintaining quality standards
Get started with Galileo today and discover how comprehensive observability can elevate your agents' development and achieve reliable AI agents that users trust.

Conor Bronsdon