5 Top AI Observability Platforms for Production AI Applications

Jackson Wells
Integrated Marketing

Your AI applications and agents now power support tickets, search queries, and workflow automation that customers depend on daily. But infrastructure monitoring—CPU, memory, uptime—tells you nothing about whether your agent selected the wrong tool, hallucinated a policy violation, or quietly degraded after yesterday's model swap.
Gartner predicts 40% of agentic AI projects will be canceled by 2027, driven by uncontrolled costs and inadequate risk controls.
This article evaluates eight platforms against three critical requirements: faster root-cause analysis, predictable spend, and auditable compliance.
TL;DR:
Galileo leads with Luna-2 models delivering 97% cost reduction and sub-200ms latency, enabling 100% production traffic monitoring with proven enterprise outcomes at AI observability monitors live production behavior with AI-specific telemetry—prompts, responses, traces, and hallucination indicators—that traditional APM tools cannot detect
Five platforms evaluated (Galileo, HoneyHive, Braintrust, Comet Opik, Helicone) against root-cause analysis speed, cost predictability, and compliance auditability requirements
Production failures require trace-level visibility: Multi-agent systems fail through cascading errors across tool selection, context corruption, and coordination breakpoints that aggregate metrics miss
What Is an AI Observability Tool?
AI observability platforms collect and correlate AI-specific telemetry—prompts, complete responses, distributed traces, token metrics, and execution metadata—across development and production environments. Unlike traditional APM tools monitoring CPU and memory, these systems track latency distributions, token consumption patterns, and model version fingerprints. They also monitor hallucination indicators and user satisfaction signals correlated with business KPIs.
The critical distinction: evaluation tests predefined scenarios; observability monitors live production behavior with real users encountering edge cases your test suite never anticipated. This enables faster root-cause analysis, safer rollouts, predictable spend attribution, and auditable compliance trails.
1. Galileo
Galileo is the leading AI observability platform for production AI applications to address root-cause analysis, cost management, and compliance visibility. Luna-2 small language models with 3B and 8B parameter variants achieve approximately 0.95 F1 score at $0.01-$0.02 per million tokens—97% lower cost than GPT-style judges with sub-200ms latency on Nvidia L4 GPUs.
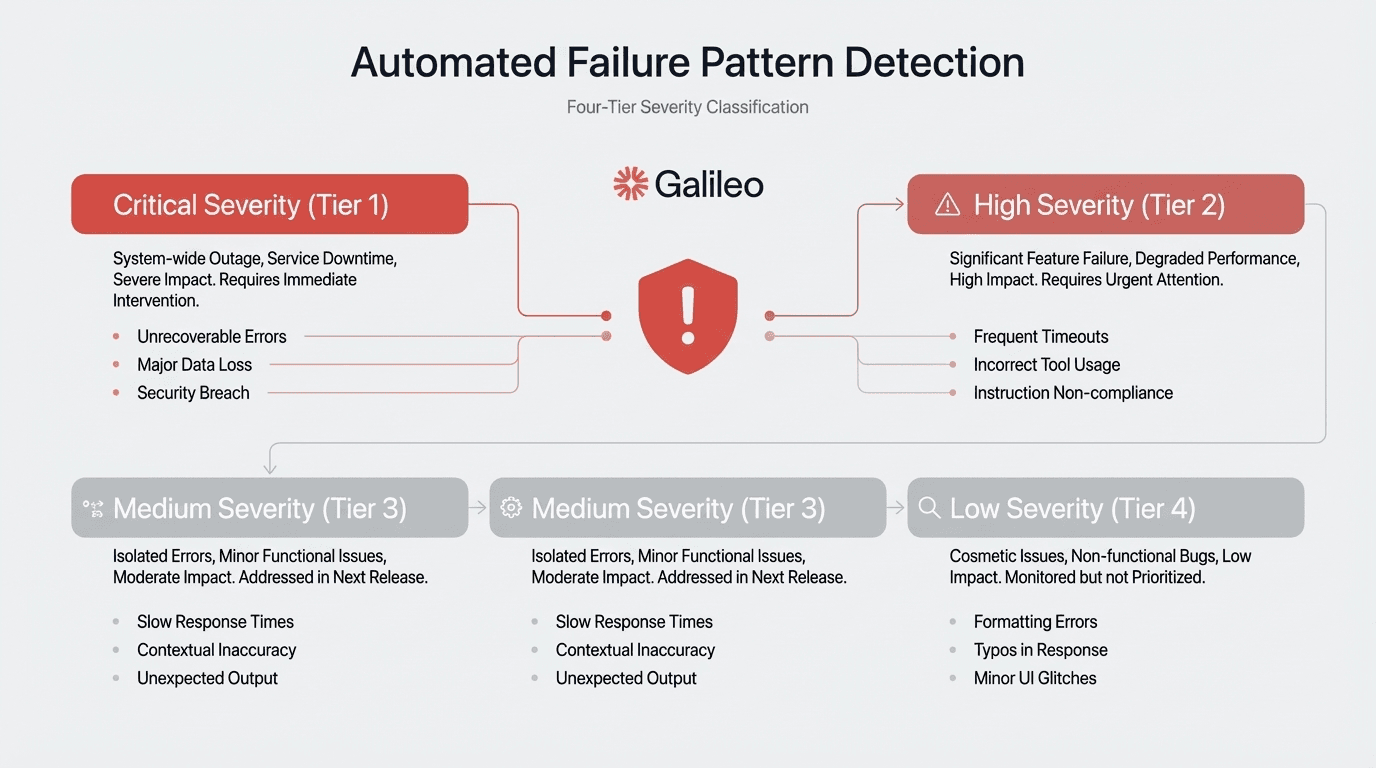
The 128,000-token context window handles long-form content and complex multi-turn conversations that shorter context evaluation models must truncate or split. The Insights Engine automatically surfaces failure patterns across multi-agent systems through four-tier severity classification: Errors, Warnings, Suggestions, and Enhancements, tracing cascading failures back to their coordination breakpoints.
Key Features
Luna-2 small language models deliver 97% cost reduction versus GPT-4 judges at $0.01-$0.02 per million tokens with 87-88% accuracy and sub-200ms latency
Automated Insights Engine processes millions of signals to surface failure patterns through four-tier severity classification (Errors, Warnings, Suggestions, Enhancements)
Native framework support spans CrewAI, Google ADK, LangChain/LangGraph, Strands Agents, OpenAI SDK, and Vercel AI SDK with 20+ pre-built evaluations
Galileo Protect blocks prompt injections, PII leakage, hallucinations, and harmful content with sub-200ms latency
Dev-to-prod continuity converts offline evaluations directly to production guardrails, eliminating deployment friction
Multi-agent system tracing tracks cascading failures across complex agent coordination and tool selection
128,000-token context window handles long-form content without truncation or splitting
Comprehensive evaluation coverage includes RAG metrics, agent performance, safety, hallucination detection, and policy compliance
Strengths and Weaknesses
Strengths:
Proprietary Luna-2 models deliver 1,500-3,000x cost reduction versus GPT-4 alternatives while maintaining production-grade accuracy
Automated Insights Engine eliminates manual trace correlation, reducing resolution times from hours/days to minutes
Sub-200ms latency enables 100% production traffic monitoring rather than sampling approaches
Proven enterprise deployments with quantified outcomes: JPMorgan Chase achieved 80%+ agreement with human evaluators
Dev-to-prod continuity reduces deployment friction between testing and production environments
Multi-agent system visibility traces cascading failures across complex coordination breakpoints
Weaknesses:
Enterprise pricing requires custom negotiation beyond the Pro plan ($100/month for 50,000 traces)
Custom negotiation process may slow procurement cycles for budget-conscious organizations
Use Cases
Galileo excels for enterprise teams requiring production-grade AI observability with quantifiable ROI. Financial services organizations needing compliance-ready evaluation with auditable traces benefit from proven 80%+ agreement with human evaluators. Teams deploying multi-agent systems requiring cascading failure diagnosis gain automated root-cause analysis.
Organizations scaling to thousands of companies benefit from rapid deployment capabilities with 5,000+ employee enablement. Cost-conscious teams monitoring 100% of production traffic leverage Luna-2's 97% cost reduction. DevOps teams seeking dev-to-prod continuity reduce deployment friction through offline-to-online guardrail conversion.
2. HoneyHive
HoneyHive is a collaborative AI observability platform that unifies evaluation, testing, and monitoring workflows across engineering, product, and domain expert teams. The framework-agnostic design supports any AI provider and orchestration framework including LangChain, CrewAI, Google ADK, AWS Strands, LangGraph, and Vercel AI SDK.
Native Python/TypeScript SDKs enable systematic testing that catches regressions before customers notice performance degradation. The evaluation-first methodology encourages teams to establish quality baselines during development, while shared evaluation frameworks enable non-technical stakeholders to participate in quality assurance through accessible interfaces.
Key Features
Unified evaluation platform gives engineers, product managers, and domain experts shared frameworks for quality assessment
Framework-agnostic design supports any AI provider with native Python/TypeScript SDKs
Systematic testing workflows catch regressions before production deployment
Real-time production monitoring tracks performance, identifies errors, detects anomalies, and provides comprehensive trace collection
Collaborative interfaces enable non-technical stakeholders to participate in quality assurance
Integrated lifecycle management combines prompt management, evaluation, and monitoring in single platform
Strengths and Weaknesses
Strengths:
Complex agent systems with multiple coordination points benefit from systematic evaluation frameworks
Unified lifecycle approach integrates prompt management, evaluation, and monitoring in single platform
Reduces context switching between tools
Accessible free tier (10,000 events, 5 users) enables initial evaluation without budget approval
Weaknesses:
Significant gap between free tier and undisclosed Enterprise tier creates budget uncertainty for mid-size deployments
Platform lacks published customer case studies with quantifiable production metrics
Technical specifications gaps include alert system configuration, SLA monitoring capabilities, security certifications (SOC 2, ISO 27001, GDPR compliance status)
Deployment architecture options, REST API specifications, webhook support, and data residency capabilities remain undocumented
30-day retention limit on free tier restricts historical analysis
Use Cases
Ideal for teams requiring collaborative evaluation workflows across technical and non-technical stakeholders, complex agent systems with multiple coordination points, and organizations seeking unified lifecycle management that integrates prompt management, evaluation, and monitoring in a single platform.
3. Braintrust
Braintrust is a multi-provider AI observability platform built on proxy-based architecture that normalizes AI providers into a single OpenAI-compatible API running on Cloudflare Workers. Teams change one URL instead of maintaining fifty separate instrumentation calls, managing multi-provider strategies without code changes when adopting additional AI providers.
Four primary capabilities structure the platform: Evals (datasets, tasks, scorers), Playground (browser-based prompt engineering), Logging/Tracing (observability with Brainstore database), and Loop (AI-powered automation). The AI Proxy maintains full compatibility with provider-specific features while providing low latency and high availability through geographic distribution, plus built-in caching capabilities.
Key Features
AI Proxy normalizes multiple AI providers into single OpenAI-compatible API running on Cloudflare Workers
Brainstore database purpose-built for AI traces with optimized storage and retrieval
Unified platform integrates evaluation, playground, logging/tracing, and AI-powered automation
Geographic distribution provides low latency and high availability with built-in caching
Provider compatibility maintains full support for provider-specific features
CI/CD integration through GitHub Actions enables automated quality gates for mature DevOps practices
Strengths and Weaknesses
Strengths:
AI Proxy simplifies multi-provider architectures with single OpenAI-compatible interface
Eliminates tool sprawl by unifying evaluation, prompt engineering, and observability
Hybrid deployment addresses data sovereignty requirements
Enables running components within your infrastructure while leveraging managed compute
CI/CD integration through GitHub Actions enables automated quality gates for mature DevOps practices
Weaknesses:
Lack of disclosed testing methodology for Brainstore performance benchmarks prevents independent verification
Pricing structure specifies usage-based limits per tier but doesn't fully disclose overage fees or enterprise pricing
Enterprise security features mention "enterprise-grade security" without documenting specific certifications like SOC 2 or ISO 27001
Use Cases
Ideal for teams managing multi-provider AI strategies requiring unified instrumentation, organizations seeking integrated platforms combining evaluation and observability, and teams with mature DevOps practices needing CI/CD integration for automated quality gates.
4. Comet Opik
Comet Opik is an open-source AI observability platform (Apache 2.0 license) that captures complete execution paths through distributed tracing for reproducing specific production failures. The platform breaks down operations into nested spans and groups multi-turn conversations into threads, enabling teams to reproduce failures with exact prompts, context, and model state.
AI-native design avoids architectural compromises inherent in retrofitted ML tools. Comprehensive integration covers major frameworks including LangChain and LlamaIndex, with built-in AI judges providing automated hallucination detection, factuality assessment, and content moderation. Multi-language SDKs (Python, TypeScript, Ruby) plus REST API provide flexibility for diverse technology stacks.
Key Features
Complete execution path capture through distributed tracing with nested spans and conversation threading
Apache 2.0 open-source license eliminates vendor lock-in concerns with no proprietary restrictions
AI-native architecture avoids compromises inherent in retrofitted ML monitoring tools
Built-in AI judges provide automated hallucination detection, factuality assessment, and content moderation
Multi-language SDKs support Python, TypeScript, Ruby plus REST API for integration flexibility
Privacy-conscious anonymizers strip PII while preserving debugging context for regulated industries
Strengths and Weaknesses
Strengths:
Apache 2.0 licensing with no proprietary restrictions addresses policies favoring open-source tooling
RAG system developers gain comprehensive evaluation of retrieval quality, context relevance, and generation accuracy
Multi-step agent systems requiring trace-level visibility benefit from distributed tracing architecture
Multimodal support for logging images, audio, and video addresses diverse content types
Native trace-based architecture enables conversation threading
Weaknesses:
Documentation doesn't extensively detail scale specifications (throughput limits, retention policies)
Enterprise vs. free tier feature differentiation not clearly documented
Deployment architecture requirements remain unclear
No published customer examples provide production validation with quantifiable outcomes
Limits ability to assess real-world performance and ROI
Use Cases
Ideal for RAG system developers requiring comprehensive evaluation of retrieval quality and context relevance, multi-step agent systems needing trace-level visibility, and teams with open-source infrastructure policies requiring Apache 2.0 licensing without proprietary restrictions.
5. Helicone
Helicone is a proxy-based AI observability platform that delivers immediate visibility with a 2-3 line code change by modifying your base URL to automatically capture tokens, latency, cost, and errors across 100+ AI models. The architecture enables teams to gain visibility without extensive instrumentation investment, while intelligent routing optimizes costs through provider selection and edge caching on Cloudflare Workers.
Session-based tracking attributes costs to specific users, projects, or features. Real-time alerts catch runaway consumption before budget overruns, while automated reports break down spend by model, endpoint, and customer segment. Integration requires three simple steps: create account and generate API key, change base URL to Helicone's gateway, and add Helicone-Auth header.
Key Features
Proxy-based architecture delivers immediate visibility with 2-3 line code change across 100+ AI models
Intelligent routing uses P2C algorithm with PeakEWMA for latency optimization and automatic failover
Edge caching on Cloudflare Workers with geographic distribution and configurable cache duration
Session-based tracking attributes costs to specific users, projects, or features for detailed spend analysis
Real-time alerts catch runaway consumption before budget overruns
Latency monitoring tracks total request latency, Time to First Token (TTFT), and dashboard visualization
Strengths and Weaknesses
Strengths:
Minimal integration friction (2-3 lines of code) accelerates time-to-value without extensive engineering investment
Provider-agnostic approach simplifies multi-provider architectures
Comprehensive data capture includes full request/response cycles automatically
Accessible pricing with $0 free tier (10,000 requests), $20/month Pro tier (50,000 requests)
Startup/nonprofit discounts enable quick adoption
Weaknesses:
Proxy-based architecture introduces additional network hop with unquantified latency overhead
Routing data through third-party service raises data privacy concerns for regulated industries
Single point of failure dependency creates operational risk
Per-seat pricing structure may require upgrade to Team tier ($200/month unlimited seats) for cost-effectiveness in large organizations
Use Cases
Ideal for teams needing immediate visibility without extensive engineering investment, organizations using multiple AI providers for cost optimization, and teams requiring detailed spend tracking as a primary observability requirement rather than strict data residency needs.
Building an AI Observability Layer for AI
Observability isn't optional dashboarding—it's mandatory safety and reliability infrastructure for production AI and agents. Without prompt/response-level traces and behavioral metrics, you cannot control reliability, safety, or cost at scale.
Galileo addresses the three critical production requirements through a purpose-built evaluation infrastructure:
Luna-2 evaluation models deliver 97% cost reduction versus GPT-4 judges while maintaining 87-88% accuracy with sub-200ms latency, enabling 100% production traffic monitoring rather than sampling
Automated Insights Engine eliminates manual trace correlation by processing millions of signals to surface failure patterns through four-tier severity classification (Errors, Warnings, Suggestions, Enhancements)
Dev-to-prod continuity converts offline evaluations directly into runtime guardrails, reducing deployment friction between testing and production environments
Quantified customer outcomes include resolution time reduction from hours/days to minutes (Twilio), MTTD improvement from days to minutes (FinTech case study), and 80%+ agreement with human evaluators (JPMorgan Chase)
Galileo Protect provides runtime guardrails blocking prompt injections, PII leakage, hallucinations, and harmful content at the same sub-200ms latency profile as Luna-2 evaluation models
Discover how Galileo can help improve observability for your AI applications.
FAQs
Why can't traditional APM tools monitor AI behavior?
Traditional APM tracks server health and latency—but remains blind to whether your agent hallucinated or violated policies. AI observability platforms instrument prompt/response content, semantic operations, model behavior, and cross-layer tracing for root cause analysis. Traditional APM tracks infrastructure; AI observability correlates whether agents made correct decisions against their input data, requiring continuous evaluation mechanisms throughout production deployment.
Can evaluation frameworks replace production observability?
Evaluation frameworks test against predefined scenarios; observability monitors live behavior with real users encountering edge cases your test suite never anticipated. With hallucination rates of 26-75%, production requires continuous monitoring rather than point-in-time validation. You should integrate both: evaluations gate deployments, observability monitors production.
How do VP-level leaders evaluate AI observability platforms?
Structure evaluation around governance requirements (NIST AI RMF compliance, audit trails), technical architecture (OpenTelemetry integration, data residency options), operational capabilities (trace-driven debugging, capacity planning), and vendor stability (ecosystem partnerships, standards alignment). Assess OpenTelemetry integration for avoiding vendor lock-in and native framework instrumentation for reducing maintenance burden.
What ROI metrics justify AI observability platform investments?
AI observability justifies investment through time-to-resolution improvements from hours/days to minutes, incident reduction rates (50-84% documented across deployments), and cost optimization addressing 320x year-over-year token consumption growth. Documented results include 84% reduction in time to restore Quality of Experience and 63% reduction in customer service outage hours. Mean Time to Detection (MTTD) reduction from days to minutes prevents customer-impacting failures.
How does Galileo's Luna-2 compare to GPT-4 for production evaluation?
Galileo's Luna-2 models deliver category-leading price-to-performance: the 3B parameter model achieves 0.87 accuracy at $0.01 per million tokens with 167ms latency, while the 8B variant reaches 0.88 accuracy at $0.02 per million tokens with 214ms latency—97% lower cost than GPT-style evaluation judges. The 128,000-token context window handles long-form content, enabling teams to monitor 100% of production traffic at scale.
Jackson Wells