What Is Toolchaining? Solving LLM Tool Orchestration Challenges

Jackson Wells
Integrated Marketing
Your production agent repeatedly called the wrong API overnight. The logs show successful completions, but customer data is corrupted. Your team spends three days tracing the decision path, discovering the agent hallucinated parameters in step one that cascaded through the entire chain.
Following this guide, you'll understand why frontier models achieve below 60% success rates on multi-tool orchestration, what architectural patterns separate successful deployments from failed pilots, and how to build reliable systems addressing state management and error propagation challenges.
TLDR:
Toolchaining sequences tool calls where outputs feed subsequent operations
Frontier LLMs achieve below 60% success on multi-tool tasks
Separate planning from execution improves success rates by 23%
Code execution outperforms JSON tool calling by 15.5 points
Comprehensive observability prevents production failures at scale
What Is Toolchaining?
Toolchaining is the sequential or dependent invocation of multiple tools or functions in an LLM system, where outputs from one call feed into subsequent calls to enable complex multi-step workflows.
Microsoft defines this as "the sequential or dependent invocation of multiple tools or functions, where outputs feed into another." Google calls this "multi-tool orchestration"—orchestrating specialized tools in sequence or parallel, with LLMs providing reasoning and tools executing actions.
When your agent analyzes customer sentiment, retrieves product data, calculates pricing, and generates recommendations—it's executing a toolchain.
Tool Calling vs. Toolchaining
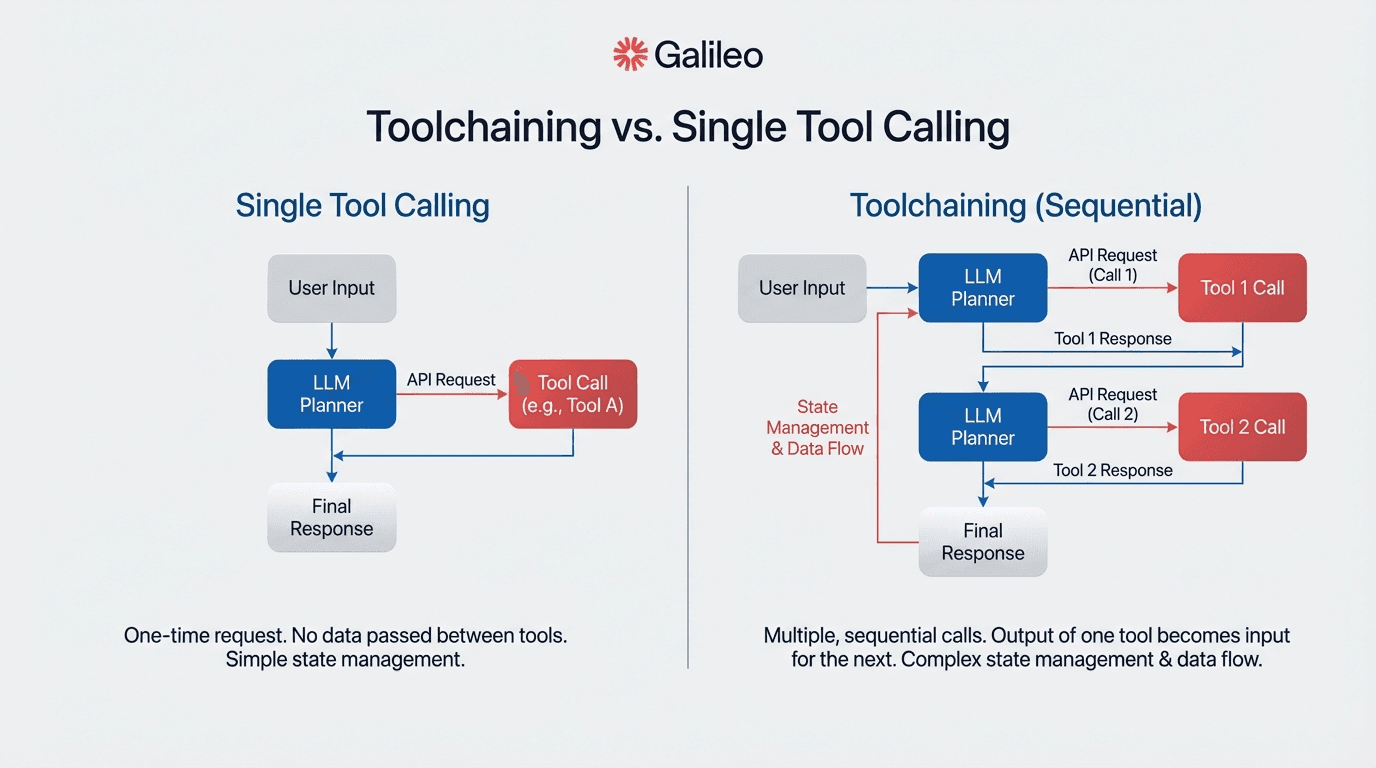
Think of tool calling as a single API request: your LLM decides whether to invoke a function, generates the parameters, and receives a response. Toolchaining orchestrates multiple such invocations where each decision depends on previous results.
Single tool calling suits focused, straightforward tasks. Multi-tool orchestration enables complex, multi-faceted problems by sequencing specialized tools or agents.
Tool calling requires atomic operation handling with simple error boundaries. Toolchaining demands state management across invocations, sophisticated error propagation handling, and context preservation through chains that may span dozens of tool invocations.
Your observability requirements transform from single-point monitoring to distributed tracing. You need comprehensive span-based monitoring that tracks LLM calls, agent decisions, tool invocations, and workflow execution with multi-modal evaluation combining automated metrics and human assessment.
Multi-Tool Reliability Gaps in Production
Agents that perform well in demos fail unpredictably in production when encountering edge cases outside their training distribution. The LiveMCP-101 benchmark reveals frontier models achieve below 60% success rates on multi-tool orchestration tasks, with process accuracy often below 50% on multi-turn scenarios.
This reliability gap creates dangerous overconfidence. Engineering leaders deploy agents, assuming they'll handle novel scenarios through reasoning, only to discover the agents simply memorized patterns from training data. When those patterns don't match production complexity, agents don't gracefully degrade, they confidently execute the wrong action sequence, creating cascading failures that corrupt data and disrupt operations.
Why Toolchaining Is Hard for LLMs
Understanding why toolchaining fails is essential before you can fix it. The root causes span both technical limitations inherent to LLM architectures and enterprise-specific operational challenges that compound in production environments.
Technical Challenges
Multi-tool orchestration tasks reveal fundamental limitations in current architectures. The challenge isn't model capability—it's the exponential complexity of multi-step decision-making under uncertainty.
Non-deterministic behavior: The same prompt yields different results across runs. Minor prompt changes cause dramatically different tool selection paths.
State management failures: The ACEBench benchmark reports process accuracy often below 50% for multi-turn agentic tasks. Your agent retrieves customer data in step one, but by step three it has lost context about which customer it's processing.
Error propagation and cascading failures: A single hallucinated parameter in step one propagates through the entire chain, corrupting downstream outputs and making root cause analysis extremely difficult.
Context window limitations: As toolchains grow longer, earlier context gets pushed out or compressed, causing agents to lose critical information needed for later decisions.
Tool selection ambiguity: When multiple tools could satisfy a request, LLMs inconsistently choose between them, leading to unpredictable execution paths and results that vary between runs.
Enterprise-Specific Pain Points
Traditional debugging tools don't work for agent decisions. The non-deterministic nature of LLMs, combined with multi-step agentic workflows, breaks conventional troubleshooting methods.
Observability represents a critical capability gap in the agent control plane market. You can see that response quality degraded, but you can't determine which agent in a multi-agent system caused the failure or what data sources influenced specific decisions requiring trace analysis. Traditional MLOps dashboards show request rates and latencies but miss the decision-level failures that matter most for agent reliability.
Agentic AI introduces novel risks: chained vulnerabilities cascade through multi-agent systems, and data leakage flows through complex tool chains. Your governance team needs real-time compliance guardrails, capabilities requiring specialized infrastructure.
Scaling from pilot to production creates organizational barriers that kill projects. Your pilot works beautifully with curated test data and manual oversight. Production demands automated quality assurance that scales beyond human review, continuous monitoring that catches degradation before customers notice, and organizational processes for managing systems that make autonomous decisions affecting revenue and risk.
ReliabilityBench research shows agents with 96.9% pass@1 accuracy in test conditions degrade to 88.1% under production-like stress conditions, an 8.8 percentage point reliability gap that threatens enterprise ROI realization.
How to Solve LLM Tool Orchestration Challenges
The good news: these challenges are solvable with the right architectural patterns. The following strategies have proven effective in production deployments, with measurable improvements in reliability and success rates.
Separate Planning from Execution
When reasoning decouples from action, failure domains stay isolated—improving overall reliability. Task-Decoupled Planning generates plans iteratively for each sub-task rather than upfront, improving task success rates by 23% for complex multi-step operations. When your planning agent operates in pure reasoning mode without tool access, execution failures can't contaminate the decision-making process.
The ReAct (Reasoning and Acting) framework uses reasoning traces to induce task plans while action steps execute tool invocations with environmental feedback informing the next reasoning step. This interleaving enables dynamic replanning based on execution results, your agent adapts when tools return unexpected outputs rather than blindly continuing a failed plan.
Use Python Code Execution Over JSON-Based Tool Calling
Code execution provides fundamentally greater expressiveness than JSON-based tool orchestration. Unlike JSON-based tool orchestration requiring manual coordination, code execution accesses dynamic runtime information and facilitates function composition directly.
The ScienceQA benchmark requiring multi-step scientific reasoning shows CodeAct agents achieved 67.8% accuracy compared to 52.3% for JSON tool-calling baselines—a 15.5 percentage point improvement attributable to architectural differences. Code execution collapses multiple generation-parsing-execution cycles into atomic operations, reducing error multiplication from chained calls.
Your code execution environment runs in Docker containers with network isolation, CPU/memory/execution time constraints, and static analysis detecting unauthorized system access. While both code execution and JSON tool calling require careful security design, code execution with verification enables capabilities that stateless JSON tool calling cannot provide.
Build Typed Interfaces and State Management
Modern frameworks implement type safety to validate data formats, types, and constraints at runtime, catching parameter mismatches before they propagate through tool chains. Production systems use Pydantic models or OpenAPI 3.0 schemas for structural correctness.
State management follows framework-specific patterns. LangChain's LangGraph uses persistent checkpointing with graph-based execution for durable state persistence across interactions. When your agent workflow crashes at step eight of a fifteen-step chain, checkpointing enables restart from the last successful state rather than beginning from scratch—a capability essential for production reliability in multi-step agentic workflows.
Validation should layer across three levels: schema validation, runtime checking, and production monitoring. Validate parameters before execution, mock dependencies for testing, and simulate failures.
Address Toolchaining Limitations Early
Implementing evaluation frameworks early prevents reliability surprises during scaling. Traditional ML metrics like accuracy and F1 fundamentally mischaracterize multi-tool agent performance.
You need task-specific success criteria measuring whether the complete workflow achieved its objective, process metrics tracking intermediate steps for partial credit, and multiple trial runs capturing behavioral distributions from non-deterministic decision-making.
Building observability infrastructure at the design stage rather than bolting it on after failures enables systematic debugging instead of reactive firefighting. Your instrumentation should capture the order of tool calls, parameters passed to each tool, execution durations, results from each invocation, and performance bottlenecks.
Without this telemetry, debugging multi-agent AI systems becomes archaeology—you're reconstructing ancient decision paths from fragmentary evidence.
Toolchaining in the Enterprise Stack
Theory becomes valuable when applied to real systems. Here's how toolchaining integrates with enterprise data infrastructure and delivers measurable business outcomes.
Integration Patterns for Data Pipelines and RAG Systems
Enterprise AI teams integrate toolchaining agents with RAG systems through modular pipeline architectures comprising ingestion, transformation, embedding, indexing, retrieval, and generation stages.
Azure AI Search architecture emphasizes LLM-assisted query planning integrated directly with retrieval operations. The pattern includes five key components: a query planning layer for intent analysis, multi-source access capabilities, parallel subquery execution, structured response assembly with citations, and semantic ranking for agent-driven relevance scoring.
Your agent decomposes complex analytical queries into specialized sub-tasks, routes them to appropriate data stores, and synthesizes results—all while maintaining authentication context across systems.
Automated Report Generation: A Toolchaining Use Case
Amazon Web Services documents a production-ready multi-agent collaboration architecture using Amazon Bedrock that can handle complex business tasks, illustrated with an example that analyzes sales data, generates insights, and creates executive summaries.
AWS validates this pattern in production environments where complex analytical queries decompose into specialized sub-tasks. The system demonstrates specialized agent roles: data retrieval, analysis, report generation, and workflow coordination agents.
Consider a quarterly business review requiring revenue trends, customer churn analysis, competitive positioning, and operational metrics. A monolithic agent approach handles this sequentially—prone to timeout failures and extended execution times.
The multi-agent architecture parallelizes data retrieval across specialized agents, performs analysis concurrently, and assembles the final report through coordinated handoffs. Parallelization reduces execution time while isolated failures only affect specific sections.
Business Impact: Faster Iteration and Lower Error Rates
Gartner's survey of 822 business leaders documents organizations reporting 22.6% average productivity improvement from generative AI deployments across business functions. Organizations with successful implementations reported 15.8% average revenue increase and 15.2% cost savings.
However, related research and commentary discuss a projected 30% abandonment rate for generative or agentic AI projects after proof of concept by the end of 2025, without attributing it specifically to poor productization practices.
Your pilot achieves impressive results with curated test cases, but production reveals performance degradation where agents with 96.9% pass@1 accuracy in test conditions drop to 88.1% under production-like stress conditions, a degradation that threatens ROI realization.
Building Proactive Reliability Systems
Toolchaining reliability separates production successes from pilot-phase failures. Frontier models achieve below 60% success on multi-tool orchestration, and the 30% project abandonment rate threatens deployments when teams can't bridge the reliability gap. The solution requires systematic observability, evaluation, and runtime protection.
Galileo provides purpose-built infrastructure for agent reliability that addresses toolchaining challenges directly:
Automated Signals for failure pattern detection: Clusters agent failures across multi-step workflows and surfaces root causes
Luna-2 evaluation models delivering order of magnitude improvements: 152ms average latency with F1 score of 0.95 and $0.02 per 1M tokens enables continuous evaluation at production scale
Agent Graph visualization for multi-step workflows: Span nodes with colorful charts help detect issues quickly within toolchains and trace decision paths
Runtime Protection blocking unsafe outputs: Rules, rulesets, and stages with custom actions prevent PII leakage and policy violations before user impact
Comprehensive toolchain monitoring: LangGraph OpenTelemetry integration captures tool invocation order, parameters, durations, and results for complete observability
Discover how Galileo transforms agent debugging from reactive firefighting to proactive reliability.
FAQs
What is the difference between tool calling and toolchaining in LLM systems?
Tool calling is a single, atomic function invocation where an LLM decides whether to call a function and generates parameters. Toolchaining is the sequential, parallel, or conditional invocation of multiple tools or functions where outputs from one call feed into subsequent calls, requiring state management, error propagation handling, and context preservation across the entire chain.
How do you debug non-deterministic failures in multi-step agent workflows?
Implement comprehensive distributed tracing capturing every tool invocation with parameters, execution duration, and results. Run multiple trial runs to capture behavioral distributions since the same inputs may produce different decision paths. Observability represents a critical capability gap in emerging agent infrastructure, necessitating purpose-built platforms that provide agent-specific visualizations, trace filtering capabilities, and root cause analysis tools rather than standard APM solutions.
How do you validate that typed interfaces prevent toolchain errors?
Production frameworks implement validation across three layers: model-level schema validation using Pydantic or OpenAPI specifications, runtime input/output checking with explicit validation functions, and production monitoring with drift detection. LangChain uses Pydantic models with Field validators, while Microsoft Semantic Kernel leverages strongly-typed method signatures. Google Vertex AI implements OpenAPI 3.0 schemas with type declarations. For testing, mock dependencies and simulate failures to validate workflow robustness.
When should you use Python code execution versus JSON-based tool calling for agent workflows?
Python code execution outperforms JSON tool calling by 15.5 percentage points on complex reasoning benchmarks like ScienceQA (67.8% vs. 52.3% accuracy). Use code execution for workflows requiring loops, conditionals, data transformations, or composing multiple operations atomically. Use JSON tool calling for simple atomic operations or high-security contexts requiring strict capability boundaries. Both approaches require proper sandboxing and security validation.
How does Galileo help with toolchaining observability and debugging?
Galileo provides Agent Graph visualization showing complete decision flows across multi-step workflows, comprehensive trace capture through OpenTelemetry integration for all major frameworks, Luna-2 evaluation models delivering 152ms average latency for continuous quality assessment, and Runtime Protection blocking harmful requests, security threats, and data privacy violations before execution. These capabilities address critical observability gaps in agent systems while providing cost-efficient evaluation at enterprise scale.
Jackson Wells